Oracle 2010 Annual Report Download - page 177
Download and view the complete annual report
Please find page 177 of the 2010 Oracle annual report below. You can navigate through the pages in the report by either clicking on the pages listed below, or by using the keyword search tool below to find specific information within the annual report.-
 1
1 -
2
-
3
-
4
-
5
-
6
-
7
-
8
-
9
-
10
-
11
-
12
-
13
-
14
-
15
-
16
-
17
-
18
-
19
-
20
-
21
-
22
-
23
-
24
-
25
-
26
-
27
-
28
-
29
-
30
-
31
-
32
-
33
-
34
-
35
-
36
-
37
-
38
-
39
-
40
-
41
-
42
-
43
-
44
-
45
-
46
-
47
-
48
-
49
-
50
-
51
-
52
-
53
-
54
-
55
-
56
-
57
-
58
-
59
-
60
-
61
-
62
-
63
-
64
-
65
-
66
-
67
-
68
-
69
-
70
-
71
-
72
-
73
-
74
-
75
-
76
-
77
-
78
-
79
-
80
-
81
-
82
-
83
-
84
-
85
-
86
-
87
-
88
-
89
-
90
-
91
-
92
-
93
-
94
-
95
-
96
-
97
-
98
-
99
-
100
-
101
-
102
-
103
-
104
-
105
-
106
-
107
-
108
-
109
-
110
-
111
-
112
-
113
-
114
-
115
-
116
-
117
-
118
-
119
-
120
-
121
-
122
-
123
-
124
-
125
-
126
-
127
-
128
-
129
-
130
-
131
-
132
-
133
-
134
-
135
-
136
-
137
-
138
-
139
-
140
-
141
-
142
-
143
-
144
-
145
-
146
-
147
-
148
-
149
-
150
-
151
-
152
-
153
-
154
-
155
-
156
-
157
-
158
-
159
-
160
-
161
-
162
-
163
-
164
-
165
-
166
-
 167
167 -
 168
168 -
 169
169 -
 170
170 -
 171
171 -
 172
172 -
 173
173 -
 174
174 -
 175
175 -
 176
176 -
 177
177 -
 178
178 -
 179
179 -
 180
180 -
 181
181 -
 182
182 -
 183
183 -
 184
184 -
 185
185 -
 186
186 -
 187
187 -
188
-
189
-
190
-
191
-
192
-
193
-
194
-
195
-
196
-
197
-
198
-
199
-
200
-
201
-
202
-
203
-
204
-
205
-
206
-
207
-
208
-
209
-
210
-
211
-
212
-
213
-
214
-
215
-
216
-
217
-
218
-
219
-
220
-
221
-
222
-
223
-
224
-
225
-
226
-
227
-
228
-
229
-
230
-
231
-
232
-
233
-
234
-
235
-
236
-
237
-
238
-
239
-
240
-
241
-
242
-
243
-
244
-
245
-
246
-
247
-
248
-
249
-
250
-
251
-
252
-
253
-
254
-
255
-
256
-
257
-
258
-
259
-
260
-
261
-
262
-
263
-
264
-
265
-
266
-
267
-
268
-
269
-
270
-
271
-
272
 |
 |

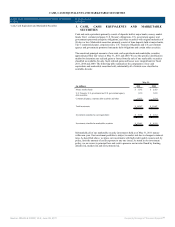
CASH, CASH EQUIVALENTS AND MARKETABLE SECURITIES
CASH, CASH EQUIVALENTS AND MARKETABLE SECURITIES
(USD $)
12 Months Ended
05/31/2011
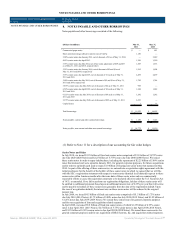
Cash, Cash Equivalents and Marketable Securities 3. CASH, CASH EQUIVALENTS AND MARKETABLE
SECURITIES
Cash and cash equivalents primarily consist of deposits held at major banks, money market
funds, Tier-1 commercial paper, U.S. Treasury obligations, U.S. government agency and
government sponsored enterprise obligations, and other securities with original maturities of
90 days or less. Marketable securities primarily consist of time deposits held at major banks,
Tier-1 commercial paper, corporate notes, U.S. Treasury obligations and U.S. government
agency and government sponsored enterprise debt obligations and certain other securities.
The amortized principal amounts of our cash, cash equivalents and marketable securities
approximated their fair values at May 31, 2011 and 2010. We use the specific identification
method to determine any realized gains or losses from the sale of our marketable securities
classified as available-for-sale. Such realized gains and losses were insignificant for fiscal
2011, 2010 and 2009. The following table summarizes the components of our cash
equivalents and marketable securities held, substantially all of which were classified as
available-for-sale:
May 31,
(in millions) 2011 2010
Money market funds $ 3,362 $ 2,423
U.S. Treasury, U.S. government and U.S. government agency
debt securities
1,150 3,010
Commercial paper, corporate debt securities and other 13,875 5,634
Total investments $ 18,387 $ 11,067
Investments classified as cash equivalents $ 5,702 $ 2,512
Investments classified as marketable securities $ 12,685 $ 8,555
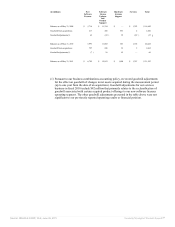
Substantially all of our marketable security investments held as of May 31, 2011 mature
within one year. Our investment portfolio is subject to market risk due to changes in interest
rates. As described above, we place our investments with high credit quality issuers and, by
policy, limit the amount of credit exposure to any one issuer. As stated in our investment
policy, we are averse to principal loss and seek to preserve our invested funds by limiting
default risk, market risk and reinvestment risk.
Source: ORACLE CORP, 10-K, June 28, 2011 Powered by Morningstar® Document Research℠