Oracle 2010 Annual Report Download - page 197
Download and view the complete annual report
Please find page 197 of the 2010 Oracle annual report below. You can navigate through the pages in the report by either clicking on the pages listed below, or by using the keyword search tool below to find specific information within the annual report.-
 1
1 -
2
-
3
-
4
-
5
-
6
-
7
-
8
-
9
-
10
-
11
-
12
-
13
-
14
-
15
-
16
-
17
-
18
-
19
-
20
-
21
-
22
-
23
-
24
-
25
-
26
-
27
-
28
-
29
-
30
-
31
-
32
-
33
-
34
-
35
-
36
-
37
-
38
-
39
-
40
-
41
-
42
-
43
-
44
-
45
-
46
-
47
-
48
-
49
-
50
-
51
-
52
-
53
-
54
-
55
-
56
-
57
-
58
-
59
-
60
-
61
-
62
-
63
-
64
-
65
-
66
-
67
-
68
-
69
-
70
-
71
-
72
-
73
-
74
-
75
-
76
-
77
-
78
-
79
-
80
-
81
-
82
-
83
-
84
-
85
-
86
-
87
-
88
-
89
-
90
-
91
-
92
-
93
-
94
-
95
-
96
-
97
-
98
-
99
-
100
-
101
-
102
-
103
-
104
-
105
-
106
-
107
-
108
-
109
-
110
-
111
-
112
-
113
-
114
-
115
-
116
-
117
-
118
-
119
-
120
-
121
-
122
-
123
-
124
-
125
-
126
-
127
-
128
-
129
-
130
-
131
-
132
-
133
-
134
-
135
-
136
-
137
-
138
-
139
-
140
-
141
-
142
-
143
-
144
-
145
-
146
-
147
-
148
-
149
-
150
-
151
-
152
-
153
-
154
-
155
-
156
-
157
-
158
-
159
-
160
-
161
-
162
-
163
-
164
-
165
-
166
-
167
-
168
-
169
-
170
-
171
-
172
-
173
-
174
-
175
-
176
-
177
-
178
-
179
-
180
-
181
-
182
-
183
-
184
-
185
-
186
-
 187
187 -
 188
188 -
 189
189 -
 190
190 -
 191
191 -
 192
192 -
 193
193 -
 194
194 -
 195
195 -
 196
196 -
 197
197 -
 198
198 -
 199
199 -
 200
200 -
 201
201 -
 202
202 -
 203
203 -
 204
204 -
 205
205 -
 206
206 -
 207
207 -
208
-
209
-
210
-
211
-
212
-
213
-
214
-
215
-
216
-
217
-
218
-
219
-
220
-
221
-
222
-
223
-
224
-
225
-
226
-
227
-
228
-
229
-
230
-
231
-
232
-
233
-
234
-
235
-
236
-
237
-
238
-
239
-
240
-
241
-
242
-
243
-
244
-
245
-
246
-
247
-
248
-
249
-
250
-
251
-
252
-
253
-
254
-
255
-
256
-
257
-
258
-
259
-
260
-
261
-
262
-
263
-
264
-
265
-
266
-
267
-
268
-
269
-
270
-
271
-
272
 |
 |

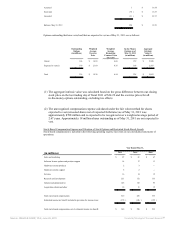
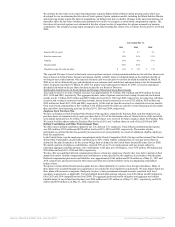
We estimate the fair value of our share-based payments using the Black-Scholes-Merton option-pricing model, which was
developed for use in estimating the fair value of stock options. Option valuation models, including the Black-Scholes-Merton
option-pricing model, require the input of assumptions, including stock price volatility. Changes in the input assumptions can
materially affect the fair value estimates and ultimately how much we recognize as stock-based compensation expense. The
fair values of our stock options were estimated at the date of grant or date of acquisition for options assumed in a business
combination. The weighted average input assumptions used and resulting fair values were as follows for fiscal 2011, 2010 and
2009:
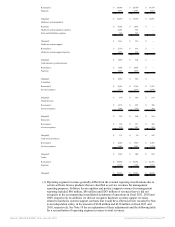
Year Ended May 31,
2011 2010 2009
Expected life (in years) 5.1 4.7 5.3
Risk-free interest rate 1.8% 2.1% 3.3%
Volatility 33% 31% 37%
Dividend yield 0.9% 0.9% —
Weighted-average fair value per share $ 6.61 $ 5.21 $ 7.93
The expected life input is based on historical exercise patterns and post-vesting termination behavior, the risk-free interest rate
input is based on United States Treasury instruments and the volatility input is calculated based on the implied volatility of
our longest-term, traded options. Our expected dividend yield was zero prior to our first dividend declaration on March 18,
2009 as we did not historically pay cash dividends on our common stock and did not anticipate doing so for the foreseeable
future for grants issued prior to March 18, 2009. For grants issued subsequent to March 18, 2009, we used an annualized
dividend yield based on the per share dividend declared by our Board of Directors.
Tax Benefits from Exercise of Stock Options and Vesting of Restricted Stock-Based Awards
Total cash received as a result of option exercises was approximately $1.3 billion, $812 million and $696 million for fiscal
2011, 2010 and 2009, respectively. The aggregate intrinsic value of options exercised and vesting of restricted stock-based
awards was $1.1 billion, $647 million and $807 million for fiscal 2011, 2010 and 2009, respectively. In connection with these
exercises and vesting of restricted stock-based awards, the tax benefits realized by us were $325 million, $203 million and
$252 million for fiscal 2011, 2010 and 2009, respectively. Of the total tax benefits received, we classified excess tax benefits
from stock-based compensation of $215 million, $110 million and $194 million as cash flows from financing activities rather
than cash flows from operating activities for fiscal 2011, 2010 and 2009, respectively.
Employee Stock Purchase Plan
We have an Employee Stock Purchase Plan (Purchase Plan) and have amended the Purchase Plan such that employees can
purchase shares of common stock at a price per share that is 95% of the fair market value of Oracle stock as of the end of the
semi-annual option period. As of May 31, 2011, 71 million shares were reserved for future issuances under the Purchase Plan.
We issued 4 million shares under the Purchase Plan for fiscal 2011 and 3 million shares in each of fiscal 2010 and 2009.
Defined Contribution and Other Postretirement Plans
We offer various defined contribution plans for our U.S. and non-U.S. employees. Total defined contribution plan expense
was $354 million, $253 million and $258 million for fiscal 2011, 2010 and 2009, respectively. The number of plan
participants in our benefit plans has generally increased in recent years primarily as a result of additional eligible employees
from our acquisitions.
In the United States, regular employees can participate in the Oracle Corporation 401(k) Savings and Investment Plan (Oracle
401(k) Plan). Participants can generally contribute up to 40% of their eligible compensation on a per-pay-period basis as
defined by the plan document or by the section 402(g) limit as defined by the United States Internal Revenue Service (IRS).
We match a portion of employee contributions, currently 50% up to 6% of compensation each pay period, subject to
maximum aggregate matching amounts. Our contributions to the plan, net of forfeitures, were $119 million, $90 million and
$78 million in fiscal 2011, 2010 and 2009, respectively.
We also offer non-qualified deferred compensation plans to certain key employees whereby they may defer a portion of their
annual base and/or variable compensation until retirement or a date specified by the employee in accordance with the plans.
Deferred compensation plan assets and liabilities were approximately $260 million and $216 million as of May 31, 2011 and
2010, respectively, and are presented in other assets and other non-current liabilities in the accompanying consolidated
balance sheets.
We sponsor certain defined benefit pension plans that are offered primarily by certain of our foreign subsidiaries. Many of
these plans were assumed through our acquisitions or are required by local regulatory requirements. We may deposit funds for
these plans with insurance companies, third party trustees, or into government-managed accounts consistent with local
regulatory requirements, as applicable. Our total defined benefit plan pension expenses were $38 million and $29 million for
fiscal 2011 and 2010 (insignificant for fiscal 2009). The aggregate projected benefit obligation and aggregate net liability
(funded status) of our defined benefit plans were $584 million and $181 million as of May 31, 2011, respectively, and $636
million and $196 million as of May 31, 2010, respectively.
Source: ORACLE CORP, 10-K, June 28, 2011 Powered by Morningstar® Document Research℠