Oracle 2010 Annual Report Download - page 238
Download and view the complete annual report
Please find page 238 of the 2010 Oracle annual report below. You can navigate through the pages in the report by either clicking on the pages listed below, or by using the keyword search tool below to find specific information within the annual report.-
 1
1 -
2
-
3
-
4
-
5
-
6
-
7
-
8
-
9
-
10
-
11
-
12
-
13
-
14
-
15
-
16
-
17
-
18
-
19
-
20
-
21
-
22
-
23
-
24
-
25
-
26
-
27
-
28
-
29
-
30
-
31
-
32
-
33
-
34
-
35
-
36
-
37
-
38
-
39
-
40
-
41
-
42
-
43
-
44
-
45
-
46
-
47
-
48
-
49
-
50
-
51
-
52
-
53
-
54
-
55
-
56
-
57
-
58
-
59
-
60
-
61
-
62
-
63
-
64
-
65
-
66
-
67
-
68
-
69
-
70
-
71
-
72
-
73
-
74
-
75
-
76
-
77
-
78
-
79
-
80
-
81
-
82
-
83
-
84
-
85
-
86
-
87
-
88
-
89
-
90
-
91
-
92
-
93
-
94
-
95
-
96
-
97
-
98
-
99
-
100
-
101
-
102
-
103
-
104
-
105
-
106
-
107
-
108
-
109
-
110
-
111
-
112
-
113
-
114
-
115
-
116
-
117
-
118
-
119
-
120
-
121
-
122
-
123
-
124
-
125
-
126
-
127
-
128
-
129
-
130
-
131
-
132
-
133
-
134
-
135
-
136
-
137
-
138
-
139
-
140
-
141
-
142
-
143
-
144
-
145
-
146
-
147
-
148
-
149
-
150
-
151
-
152
-
153
-
154
-
155
-
156
-
157
-
158
-
159
-
160
-
161
-
162
-
163
-
164
-
165
-
166
-
167
-
168
-
169
-
170
-
171
-
172
-
173
-
174
-
175
-
176
-
177
-
178
-
179
-
180
-
181
-
182
-
183
-
184
-
185
-
186
-
187
-
188
-
189
-
190
-
191
-
192
-
193
-
194
-
195
-
196
-
197
-
198
-
199
-
200
-
201
-
202
-
203
-
204
-
205
-
206
-
207
-
208
-
209
-
210
-
211
-
212
-
213
-
214
-
215
-
216
-
217
-
218
-
219
-
220
-
221
-
222
-
223
-
224
-
225
-
226
-
227
-
 228
228 -
 229
229 -
 230
230 -
 231
231 -
 232
232 -
 233
233 -
 234
234 -
 235
235 -
 236
236 -
 237
237 -
 238
238 -
 239
239 -
 240
240 -
 241
241 -
 242
242 -
 243
243 -
 244
244 -
 245
245 -
 246
246 -
 247
247 -
 248
248 -
249
-
250
-
251
-
252
-
253
-
254
-
255
-
256
-
257
-
258
-
259
-
260
-
261
-
262
-
263
-
264
-
265
-
266
-
267
-
268
-
269
-
270
-
271
-
272
 |
 |

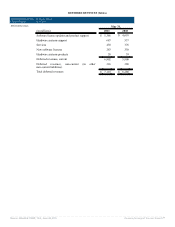
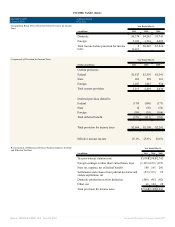
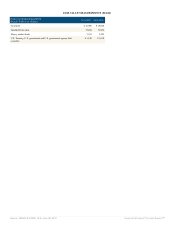
Total services business:
Revenues(1) $4,662 $3,929 $4,386
Services expenses 3,643 3,245 3,534
Margin(2) $1,019 $684 $852
Totals:
Revenues(1) $35,850 $27,034 $23,495
Expenses 13,721 9,748 8,552
Margin(2) $22,129 $17,286 $14,943
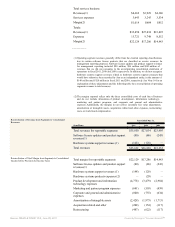
__________
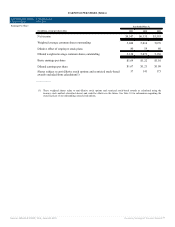
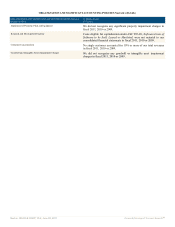
(1) Operating segment revenues generally differ from the external reporting classifications
due to certain software license products that are classified as service revenues for
management reporting purposes. Software license updates and product support revenues
for management reporting included $80 million, $86 million and $243 million of
revenues that we did not recognize in the accompanying consolidated statements of
operations in fiscal 2011, 2010 and 2009, respectively. In addition, we did not recognize
hardware systems support revenues related to hardware systems support contracts that
would have otherwise been recorded by Sun as an independent entity, in the amount of
$148 million and $128 million in fiscal 2011 and 2010, respectively. See Note 10 for an
explanation of these adjustments and the following table for a reconciliation of operating
segment revenues to total revenues.
(2) The margins reported reflect only the direct controllable costs of each line of business
and do not include allocations of product development, information technology,
marketing and partner programs, and corporate and general and administrative
expenses. Additionally, the margins do not reflect inventory fair value adjustments,
amortization of intangible assets, acquisition related and other expenses, restructuring
costs, or stock-based compensation.
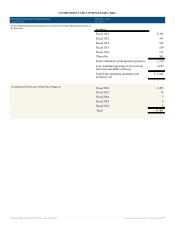
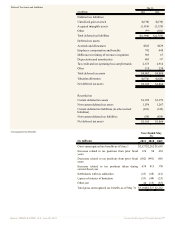
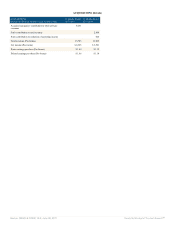
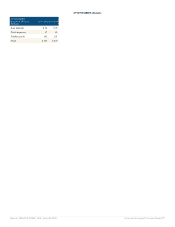
Reconciliation of Revenue from Segments to Consolidated
Revenues Year Ended May 31,
(in millions) 2011 2010 2009
Total revenues for reportable segments $35,850 $27,034 $23,495
Software license updates and product support
revenues(1)
(80) (86) (243)
Hardware systems support revenues (1) (148) (128) —
Total revenues $35,622 $26,820 $23,252
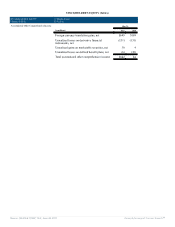
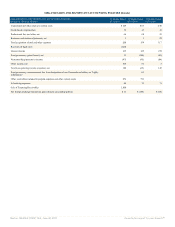
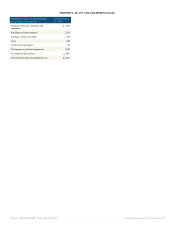
Reconciliation of Total Margin from Segments to Consolidated
Income before Provision for Income Taxes Total margin for reportable segments $22,129 $17,286 $14,943
Software license updates and product support
revenues(1)
(80) (86) (243)
Hardware systems support revenues (1) (148) (128) —
Hardware systems products expenses (2) —(29) —
Product development and information
technology expenses
(4,778) (3,479) (2,984)
Marketing and partner program expenses (601) (503) (439)
Corporate and general and administrative
expenses
(800) (755) (634)
Amortization of intangible assets (2,428) (1,973) (1,713)
Acquisition related and other (208) (154) (117)
Restructuring (487) (622) (117)
Source: ORACLE CORP, 10-K, June 28, 2011 Powered by Morningstar® Document Research℠