Oracle 2010 Annual Report Download - page 267
Download and view the complete annual report
Please find page 267 of the 2010 Oracle annual report below. You can navigate through the pages in the report by either clicking on the pages listed below, or by using the keyword search tool below to find specific information within the annual report.-
 1
1 -
2
-
3
-
4
-
5
-
6
-
7
-
8
-
9
-
10
-
11
-
12
-
13
-
14
-
15
-
16
-
17
-
18
-
19
-
20
-
21
-
22
-
23
-
24
-
25
-
26
-
27
-
28
-
29
-
30
-
31
-
32
-
33
-
34
-
35
-
36
-
37
-
38
-
39
-
40
-
41
-
42
-
43
-
44
-
45
-
46
-
47
-
48
-
49
-
50
-
51
-
52
-
53
-
54
-
55
-
56
-
57
-
58
-
59
-
60
-
61
-
62
-
63
-
64
-
65
-
66
-
67
-
68
-
69
-
70
-
71
-
72
-
73
-
74
-
75
-
76
-
77
-
78
-
79
-
80
-
81
-
82
-
83
-
84
-
85
-
86
-
87
-
88
-
89
-
90
-
91
-
92
-
93
-
94
-
95
-
96
-
97
-
98
-
99
-
100
-
101
-
102
-
103
-
104
-
105
-
106
-
107
-
108
-
109
-
110
-
111
-
112
-
113
-
114
-
115
-
116
-
117
-
118
-
119
-
120
-
121
-
122
-
123
-
124
-
125
-
126
-
127
-
128
-
129
-
130
-
131
-
132
-
133
-
134
-
135
-
136
-
137
-
138
-
139
-
140
-
141
-
142
-
143
-
144
-
145
-
146
-
147
-
148
-
149
-
150
-
151
-
152
-
153
-
154
-
155
-
156
-
157
-
158
-
159
-
160
-
161
-
162
-
163
-
164
-
165
-
166
-
167
-
168
-
169
-
170
-
171
-
172
-
173
-
174
-
175
-
176
-
177
-
178
-
179
-
180
-
181
-
182
-
183
-
184
-
185
-
186
-
187
-
188
-
189
-
190
-
191
-
192
-
193
-
194
-
195
-
196
-
197
-
198
-
199
-
200
-
201
-
202
-
203
-
204
-
205
-
206
-
207
-
208
-
209
-
210
-
211
-
212
-
213
-
214
-
215
-
216
-
217
-
218
-
219
-
220
-
221
-
222
-
223
-
224
-
225
-
226
-
227
-
228
-
229
-
230
-
231
-
232
-
233
-
234
-
235
-
236
-
237
-
238
-
239
-
240
-
241
-
242
-
243
-
244
-
245
-
246
-
247
-
248
-
249
-
250
-
251
-
252
-
253
-
254
-
255
-
256
-
 257
257 -
 258
258 -
 259
259 -
 260
260 -
 261
261 -
 262
262 -
 263
263 -
 264
264 -
 265
265 -
 266
266 -
 267
267 -
 268
268 -
 269
269 -
 270
270 -
 271
271 -
 272
272
 |
 |

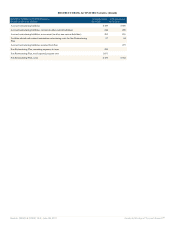
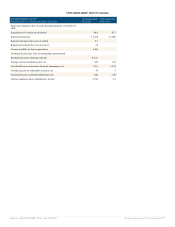
SEGMENT INFORMATION (Details)
SEGMENT INFORMATION
(Details) (USD $) (in Millions)
12 Months Ended
05/31/2011
12 Months Ended
05/31/2010
12 Months Ended
05/31/2009
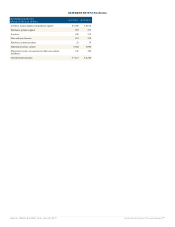
Total revenues for reportable segments $ 35,850 $ 27,034 $ 23,495
Software license updates and product support revenues (80) (86) (243)
Hardware systems support revenues (148) (128)
Total revenues 35,622 26,820 23,252
Total margin for reportable segments 22,129 17,286 14,943
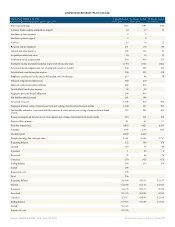
Software license updates and product support revenues (80) (86) (243)
Hardware systems support revenues (148) (128)
Hardware systems products expenses (fair value
adjustment)
(29)
Product development and information technology
expenses
(4,778) (3,479) (2,984)
Marketing and partner program expenses (601) (503) (439)
Corporate and general and administrative expenses (800) (755) (634)
Amortization of Intangible Assets (2,428) (1,973) (1,713)
Acquisition related and other (208) (154) (117)
Restructuring (487) (622) (117)
Stock-based compensation (500) (421) (340)
Interest expense (808) (754) (630)
Non-operating income (expense), net 120 (139) 108
Income before provision for income taxes 11,411 8,243 7,834
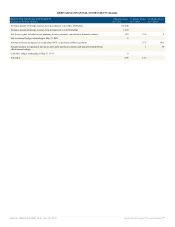
Revenues 9,220 7,525 7,112
Sales and distribution expenses 4,692 3,980 4,006
Margin 4,528 3,545 3,106
Revenues 14,876 13,175 11,997
Software license updates and product support expenses 1,144 958 1,012
Margin 13,732 12,217 10,985
Revenues 24,096 20,700 19,109
Expenses 5,836 4,938 5,018
Margin 18,260 15,762 14,091
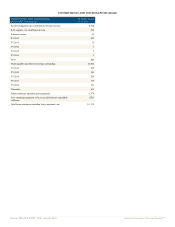
Revenues 4,382 1,493
Hardware systems products expenses 2,061 850
Sales and distribution expenses 960 307
Margin 1,361 336
Revenues 2,710 912
Hardware systems support expenses 1,221 408
Margin 1,489 504
Revenues 7,092 2,405
Expenses 4,242 1,565
Margin 2,850 840
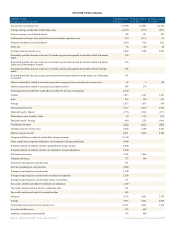
Revenues 2,901 2,705 3,221
Services expenses 2,331 2,319 2,686
Margin 570 386 535
Revenues 1,376 887 780
Services expenses 1,042 679 566
Margin 334 208 214
Revenues 385 337 385
Source: ORACLE CORP, 10-K, June 28, 2011 Powered by Morningstar® Document Research℠