Oracle 2010 Annual Report Download - page 112
Download and view the complete annual report
Please find page 112 of the 2010 Oracle annual report below. You can navigate through the pages in the report by either clicking on the pages listed below, or by using the keyword search tool below to find specific information within the annual report.-
 1
1 -
2
-
3
-
4
-
5
-
6
-
7
-
8
-
9
-
10
-
11
-
12
-
13
-
14
-
15
-
16
-
17
-
18
-
19
-
20
-
21
-
22
-
23
-
24
-
25
-
26
-
27
-
28
-
29
-
30
-
31
-
32
-
33
-
34
-
35
-
36
-
37
-
38
-
39
-
40
-
41
-
42
-
43
-
44
-
45
-
46
-
47
-
48
-
49
-
50
-
51
-
52
-
53
-
54
-
55
-
56
-
57
-
58
-
59
-
60
-
61
-
62
-
63
-
64
-
65
-
66
-
67
-
68
-
69
-
70
-
71
-
72
-
73
-
74
-
75
-
76
-
77
-
78
-
79
-
80
-
81
-
82
-
83
-
84
-
85
-
86
-
87
-
88
-
89
-
90
-
91
-
92
-
93
-
94
-
95
-
96
-
97
-
98
-
99
-
100
-
101
-
 102
102 -
 103
103 -
 104
104 -
 105
105 -
 106
106 -
 107
107 -
 108
108 -
 109
109 -
 110
110 -
 111
111 -
 112
112 -
 113
113 -
 114
114 -
 115
115 -
 116
116 -
 117
117 -
 118
118 -
 119
119 -
 120
120 -
 121
121 -
 122
122 -
123
-
124
-
125
-
126
-
127
-
128
-
129
-
130
-
131
-
132
-
133
-
134
-
135
-
136
-
137
-
138
-
139
-
140
-
141
-
142
-
143
-
144
-
145
-
146
-
147
-
148
-
149
-
150
-
151
-
152
-
153
-
154
-
155
-
156
-
157
-
158
-
159
-
160
-
161
-
162
-
163
-
164
-
165
-
166
-
167
-
168
-
169
-
170
-
171
-
172
-
173
-
174
-
175
-
176
-
177
-
178
-
179
-
180
-
181
-
182
-
183
-
184
-
185
-
186
-
187
-
188
-
189
-
190
-
191
-
192
-
193
-
194
-
195
-
196
-
197
-
198
-
199
-
200
-
201
-
202
-
203
-
204
-
205
-
206
-
207
-
208
-
209
-
210
-
211
-
212
-
213
-
214
-
215
-
216
-
217
-
218
-
219
-
220
-
221
-
222
-
223
-
224
-
225
-
226
-
227
-
228
-
229
-
230
-
231
-
232
-
233
-
234
-
235
-
236
-
237
-
238
-
239
-
240
-
241
-
242
-
243
-
244
-
245
-
246
-
247
-
248
-
249
-
250
-
251
-
252
-
253
-
254
-
255
-
256
-
257
-
258
-
259
-
260
-
261
-
262
-
263
-
264
-
265
-
266
-
267
-
268
-
269
-
270
-
271
-
272
 |
 |
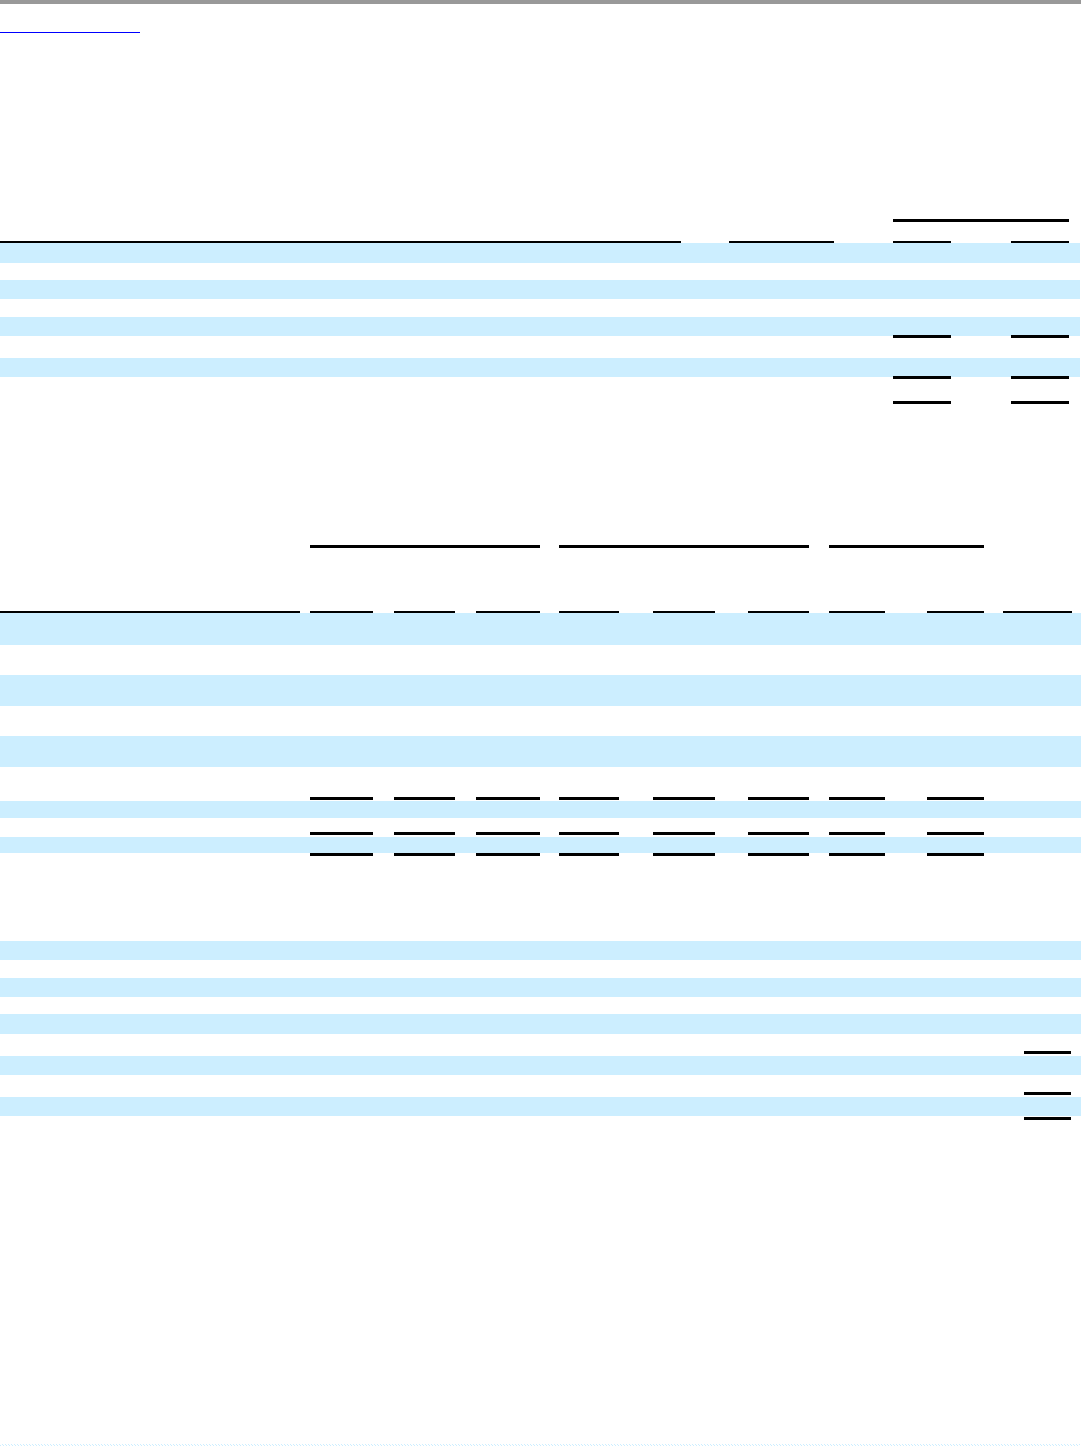
Table of Contents
ORACLE CORPORATION
NOTES TO CONSOLIDATED FINANCIAL STATEMENTS—(Continued)
May 31, 2011
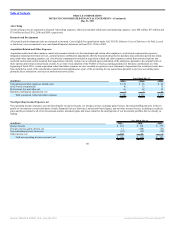
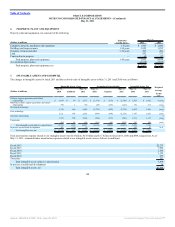
6. PROPERTY, PLANT AND EQUIPMENT
Property, plant and equipment, net consisted of the following:
Estimated
Useful Lives
May 31,
(Dollars in millions) 2011 2010
Computer, network, machinery and equipment 1-5 years $ 1,603 $ 1,400
Buildings and improvements 1-50 years 2,245 1,995
Furniture, fixtures and other 3-10 years 495 409
Land — 692 757
Construction in progress — 60 87
Total property, plant and equipment 1-50 years 5,095 4,648
Accumulated depreciation (2,238) (1,885)
Total property, plant and equipment, net $ 2,857 $ 2,763
7. INTANGIBLE ASSETS AND GOODWILL
The changes in intangible assets for fiscal 2011 and the net book value of intangible assets at May 31, 2011 and 2010 were as follows:
Intangible Assets, Gross Accumulated Amortization Intangible Assets, Net Weighted
Average
Useful
Life
May 31, May 31, May 31, May 31, May 31, May 31,
(Dollars in millions) 2010 Additions 2011 2010 Expense 2011 2010 2011
Software support agreements and related
relationships $ 5,078 $ 99 $ 5,177 $ (2,175) $ (570) $ (2,745) $ 2,903 $ 2,432 9 years
Hardware systems support agreements and related
relationships 759 1 760 (29) (118) (147) 730 613
7
years
Developed technology
5,338 696 6,034 (2,736) (992) (3,728) 2,602 2,306
5
years
Core technology
2,111 184 2,295 (964) (308) (1,272) 1,147 1,023
5
years
Customer relationships
1,765 298 2,063 (554) (372) (926) 1,211 1,137
7
years
Trademarks
504 24 528 (161) (68) (229) 343 299
7
years
Total intangible assets subject to amortization 15,555 1,302 16,857 (6,619) (2,428) (9,047) 8,936 7,810
In-process research and development 385 (335) 50 — — — 385 50 N.A.
Total intangible assets, net $ 15,940 $ 967 $ 16,907 $ (6,619) $ (2,428) $ (9,047) $ 9,321 $ 7,860
Total amortization expense related to our intangible assets was $2.4 billion, $2.0 billion and $1.7 billion in fiscal 2011, 2010 and 2009, respectively. As of
May 31, 2011, estimated future amortization expenses related to our intangible assets were as follows (in millions):
Fiscal 2012 $2,275
Fiscal 2013 1,902
Fiscal 2014 1,554
Fiscal 2015 1,155
Fiscal 2016 657
Thereafter 267
Total intangible assets subject to amortization 7,810
In-process research and development 50
Total intangible assets, net $7,860
108
Source: ORACLE CORP, 10-K, June 28, 2011 Powered by Morningstar® Document Research℠