Oracle 2010 Annual Report Download - page 71
Download and view the complete annual report
Please find page 71 of the 2010 Oracle annual report below. You can navigate through the pages in the report by either clicking on the pages listed below, or by using the keyword search tool below to find specific information within the annual report.-
 1
1 -
2
-
3
-
4
-
5
-
6
-
7
-
8
-
9
-
10
-
11
-
12
-
13
-
14
-
15
-
16
-
17
-
18
-
19
-
20
-
21
-
22
-
23
-
24
-
25
-
26
-
27
-
28
-
29
-
30
-
31
-
32
-
33
-
34
-
35
-
36
-
37
-
38
-
39
-
40
-
41
-
42
-
43
-
44
-
45
-
46
-
47
-
48
-
49
-
50
-
51
-
52
-
53
-
54
-
55
-
56
-
57
-
58
-
59
-
60
-
 61
61 -
 62
62 -
 63
63 -
 64
64 -
 65
65 -
 66
66 -
 67
67 -
 68
68 -
 69
69 -
 70
70 -
 71
71 -
 72
72 -
 73
73 -
 74
74 -
 75
75 -
 76
76 -
 77
77 -
 78
78 -
 79
79 -
 80
80 -
 81
81 -
82
-
83
-
84
-
85
-
86
-
87
-
88
-
89
-
90
-
91
-
92
-
93
-
94
-
95
-
96
-
97
-
98
-
99
-
100
-
101
-
102
-
103
-
104
-
105
-
106
-
107
-
108
-
109
-
110
-
111
-
112
-
113
-
114
-
115
-
116
-
117
-
118
-
119
-
120
-
121
-
122
-
123
-
124
-
125
-
126
-
127
-
128
-
129
-
130
-
131
-
132
-
133
-
134
-
135
-
136
-
137
-
138
-
139
-
140
-
141
-
142
-
143
-
144
-
145
-
146
-
147
-
148
-
149
-
150
-
151
-
152
-
153
-
154
-
155
-
156
-
157
-
158
-
159
-
160
-
161
-
162
-
163
-
164
-
165
-
166
-
167
-
168
-
169
-
170
-
171
-
172
-
173
-
174
-
175
-
176
-
177
-
178
-
179
-
180
-
181
-
182
-
183
-
184
-
185
-
186
-
187
-
188
-
189
-
190
-
191
-
192
-
193
-
194
-
195
-
196
-
197
-
198
-
199
-
200
-
201
-
202
-
203
-
204
-
205
-
206
-
207
-
208
-
209
-
210
-
211
-
212
-
213
-
214
-
215
-
216
-
217
-
218
-
219
-
220
-
221
-
222
-
223
-
224
-
225
-
226
-
227
-
228
-
229
-
230
-
231
-
232
-
233
-
234
-
235
-
236
-
237
-
238
-
239
-
240
-
241
-
242
-
243
-
244
-
245
-
246
-
247
-
248
-
249
-
250
-
251
-
252
-
253
-
254
-
255
-
256
-
257
-
258
-
259
-
260
-
261
-
262
-
263
-
264
-
265
-
266
-
267
-
268
-
269
-
270
-
271
-
272
 |
 |

Table of Contents
Fiscal 2010 Compared to Fiscal 2009: We incurred non-operating expenses, net in fiscal 2010 in comparison to non-operating income, net in fiscal 2009
primarily due to net foreign currency losses relating to our Venezuelan subsidiary’s operations in fiscal 2010 as described above. Additionally, interest income
decreased in fiscal 2010 due to a general decline in market interest rates that resulted in lower yields earned on our cash, cash equivalents and marketable
securities balances. Both of the aforementioned items contributed to the change in fiscal 2010 but were partially offset by gains due to favorable changes in the
values of our marketable securities that we classify as trading that were held to support our deferred compensation plan obligations.
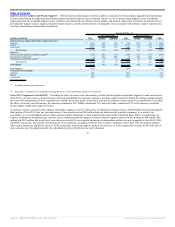
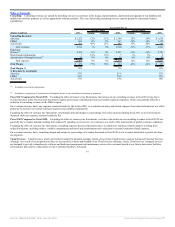
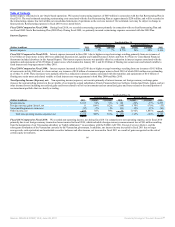
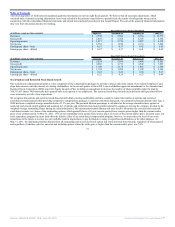
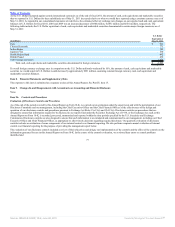
Provision for Income Taxes: Our effective tax rate in all periods is the result of the mix of income earned in various tax jurisdictions that apply a broad range
of income tax rates. The provision for income taxes differs from the tax computed at the U.S. federal statutory income tax rate due primarily to state taxes and
earnings considered as indefinitely reinvested in foreign operations. Future effective tax rates could be adversely affected if earnings are lower than anticipated in
countries where we have lower statutory rates, by unfavorable changes in tax laws and regulations or by adverse rulings in tax related litigation.
Year Ended May 31,
Percent Change Percent Change
(Dollars in millions) 2011 Actual Constant 2010 Actual Constant 2009
Provision for income taxes $ 2,864 36% 32% $ 2,108 -6% -9% $ 2,241
Effective tax rate 25.1% 25.6% 28.6%
Fiscal 2011 Compared to Fiscal 2010: Provision for income taxes increased during fiscal 2011 due substantially to higher income before provision for income
taxes and a reduction in the impact of favorable judicial decisions and settlements with worldwide taxing authorities.
Fiscal 2010 Compared to Fiscal 2009: Provision for income taxes decreased during fiscal 2010 primarily due to recent judicial decisions, including the March
2010 U.S. Court of Appeals Ninth Circuit ruling in Xilinx v. Commissioner, and settlements with various worldwide taxing authorities. These decreases were
partially offset by higher income before provision for income taxes and by a lower proportion of our worldwide taxable income being earned in lower tax rate
jurisdictions.
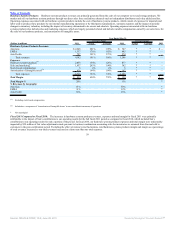
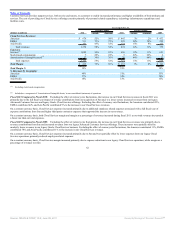
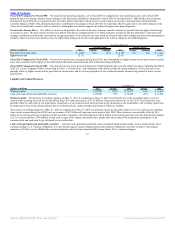
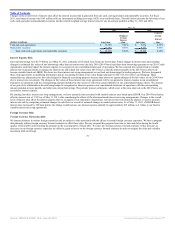
Liquidity and Capital Resources
As of May 31,
(Dollars in millions) 2011 Change 2010 Change 2009
Working capital $ 24,982 103% $ 12,313 31% $ 9,432
Cash, cash equivalents and marketable securities $ 28,848 56% $ 18,469 46% $ 12,624
Working capital: The increase in working capital as of May 31, 2011 in comparison to May 31, 2010 was primarily due to the favorable impact to our net
current assets resulting from our net income during fiscal 2011 and our issuance of $3.25 billion of long-term senior notes in July 2010. These increases were
partially offset by cash used for our acquisitions, repurchases of our common stock and cash used to pay dividends to our stockholders. Our working capital may
be impacted by some of the aforementioned factors in future periods, certain amounts and timing of which are variable.
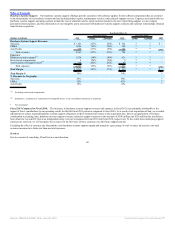
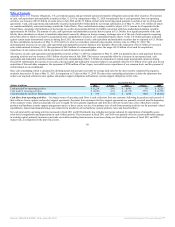
The increase in working capital as of May 31, 2010 in comparison to May 31, 2009 was primarily due to the favorable impact to our net current assets resulting
from our net income during fiscal 2010 and our issuance of $4.5 billion of long-term senior notes in July 2009. These increases were partially offset by $5.6
billion of net cash used for our acquisition of Sun and other companies, the reclassification of $2.2 billion of our senior notes that were due and repaid in January
2011 as a current liability, $700 million of cash used to repay Sun’s legacy convertible notes shortly after the closing of the acquisition, repurchases of our
common stock and cash used to pay dividends to our stockholders.
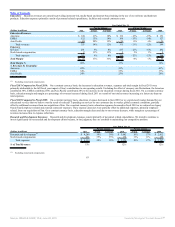
Cash, cash equivalents and marketable securities: Cash and cash equivalents primarily consist of deposits held at major banks, money market funds, Tier-1
commercial paper, U.S. Treasury obligations, U.S. government agency and government sponsored enterprise obligations, and other securities with original
maturities of 90 days or less. Marketable securities primarily consist of time deposits held at major banks, Tier-1 commercial paper,
67
Source: ORACLE CORP, 10-K, June 28, 2011 Powered by Morningstar® Document Research℠