Oracle 2010 Annual Report Download - page 68
Download and view the complete annual report
Please find page 68 of the 2010 Oracle annual report below. You can navigate through the pages in the report by either clicking on the pages listed below, or by using the keyword search tool below to find specific information within the annual report.-
 1
1 -
2
-
3
-
4
-
5
-
6
-
7
-
8
-
9
-
10
-
11
-
12
-
13
-
14
-
15
-
16
-
17
-
18
-
19
-
20
-
21
-
22
-
23
-
24
-
25
-
26
-
27
-
28
-
29
-
30
-
31
-
32
-
33
-
34
-
35
-
36
-
37
-
38
-
39
-
40
-
41
-
42
-
43
-
44
-
45
-
46
-
47
-
48
-
49
-
50
-
51
-
52
-
53
-
54
-
55
-
56
-
57
-
 58
58 -
 59
59 -
 60
60 -
 61
61 -
 62
62 -
 63
63 -
 64
64 -
 65
65 -
 66
66 -
 67
67 -
 68
68 -
 69
69 -
 70
70 -
 71
71 -
 72
72 -
 73
73 -
 74
74 -
 75
75 -
 76
76 -
 77
77 -
 78
78 -
79
-
80
-
81
-
82
-
83
-
84
-
85
-
86
-
87
-
88
-
89
-
90
-
91
-
92
-
93
-
94
-
95
-
96
-
97
-
98
-
99
-
100
-
101
-
102
-
103
-
104
-
105
-
106
-
107
-
108
-
109
-
110
-
111
-
112
-
113
-
114
-
115
-
116
-
117
-
118
-
119
-
120
-
121
-
122
-
123
-
124
-
125
-
126
-
127
-
128
-
129
-
130
-
131
-
132
-
133
-
134
-
135
-
136
-
137
-
138
-
139
-
140
-
141
-
142
-
143
-
144
-
145
-
146
-
147
-
148
-
149
-
150
-
151
-
152
-
153
-
154
-
155
-
156
-
157
-
158
-
159
-
160
-
161
-
162
-
163
-
164
-
165
-
166
-
167
-
168
-
169
-
170
-
171
-
172
-
173
-
174
-
175
-
176
-
177
-
178
-
179
-
180
-
181
-
182
-
183
-
184
-
185
-
186
-
187
-
188
-
189
-
190
-
191
-
192
-
193
-
194
-
195
-
196
-
197
-
198
-
199
-
200
-
201
-
202
-
203
-
204
-
205
-
206
-
207
-
208
-
209
-
210
-
211
-
212
-
213
-
214
-
215
-
216
-
217
-
218
-
219
-
220
-
221
-
222
-
223
-
224
-
225
-
226
-
227
-
228
-
229
-
230
-
231
-
232
-
233
-
234
-
235
-
236
-
237
-
238
-
239
-
240
-
241
-
242
-
243
-
244
-
245
-
246
-
247
-
248
-
249
-
250
-
251
-
252
-
253
-
254
-
255
-
256
-
257
-
258
-
259
-
260
-
261
-
262
-
263
-
264
-
265
-
266
-
267
-
268
-
269
-
270
-
271
-
272
 |
 |
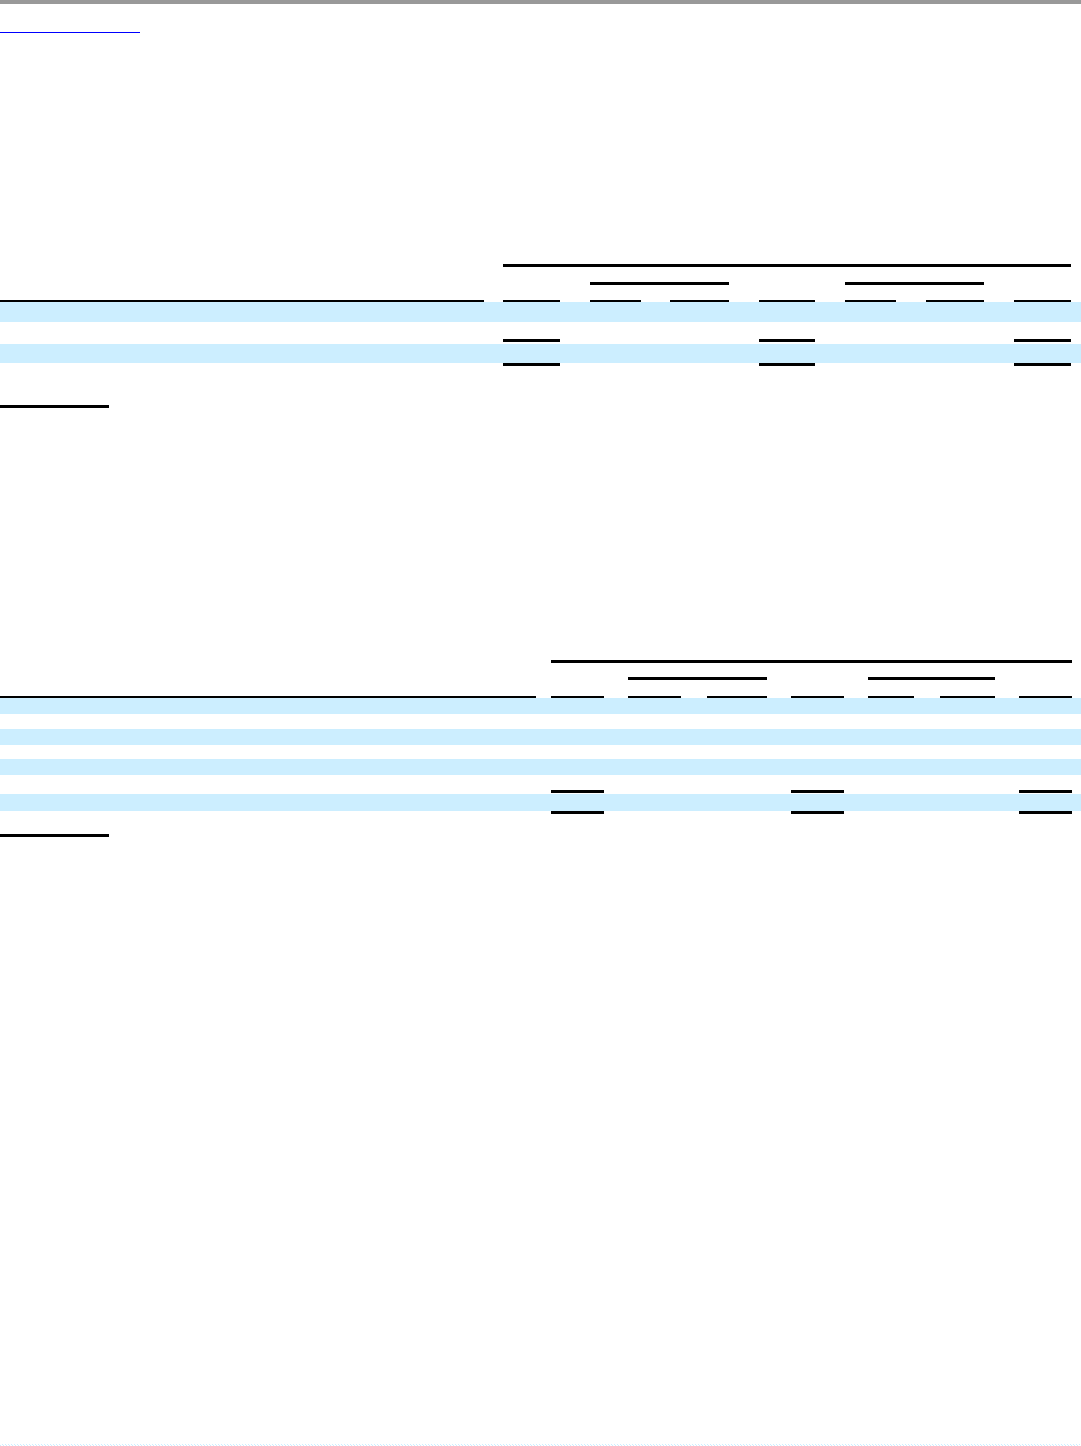
Table of Contents
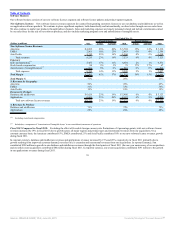
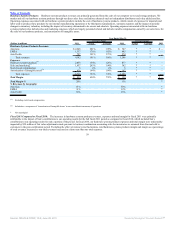
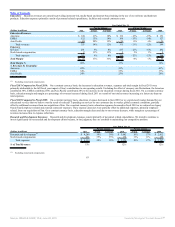
Fiscal 2011 Compared to Fiscal 2010: On a constant currency basis, total research and development expenses increased during fiscal 2011 primarily due to the
impact of Sun’s contributions to our expenses for the full fiscal year, including additional employee related expenses such as salaries, variable compensation,
benefits and stock-based compensation from increased headcount and, to a lesser extent, increased expenses related to facilities, and other infrastructure costs.
Fiscal 2010 Compared to Fiscal 2009: On a constant currency basis, total research and development expenses increased during fiscal 2010 primarily due to an
increase in employee related expenses similar to those noted above as a result of our acquisition of Sun. In addition, our expenses in fiscal 2010 were also
impacted by higher benefits expenses due to an increase in deferred compensation plan obligations and were partially offset by lower external contractor
expenses.
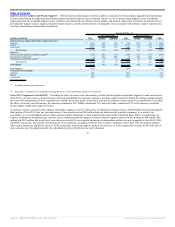
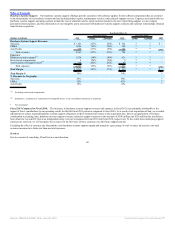
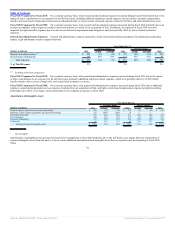
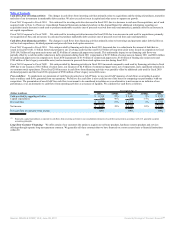
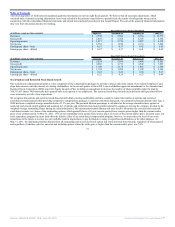
General and Administrative Expenses: General and administrative expenses primarily consist of personnel related expenditures for information technology,
finance, legal and human resources support functions.
Year Ended May 31,
Percent Change Percent Change
(Dollars in millions) 2011 Actual Constant 2010 Actual Constant 2009
General and administrative(1) $ 825 6% 4% $ 779 13% 13% $ 692
Stock-based compensation 145 10% 10% 132 41% 41% 93
Total expenses $ 970 6% 5% $ 911 16% 16% $ 785
% of Total Revenues 3% 3% 3%
(1) Excluding stock-based compensation
Fiscal 2011 Compared to Fiscal 2010: On a constant currency basis, total general and administrative expenses increased during fiscal 2011 due to the impact
of Sun’s contributions to our expenses for the full fiscal year, primarily additional employee related expenses, which were partially offset by a $120 million
benefit related to the recovery of legal costs, and certain other insurance recoveries.
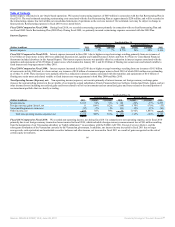
Fiscal 2010 Compared to Fiscal 2009: On a constant currency basis, total general and administrative expenses increased during fiscal 2010 due to additional
employee related and professional services expenses resulting from our acquisition of Sun, and higher stock-based compensation expenses primarily resulting
from higher fair values of our legacy stock options that were recognized as expense in fiscal 2010.
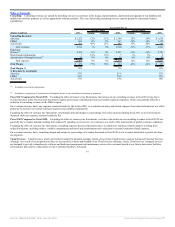
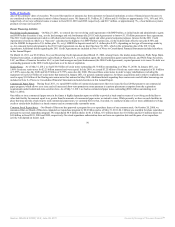
Amortization of Intangible Assets:
Year Ended May 31,
Percent Change Percent Change
(Dollars in millions) 2011 Actual Constant 2010 Actual Constant 2009
Software support agreements and related relationships $ 570 -1% -1% $ 574 5% 5% $ 549
Hardware systems support agreements and related relationships 118 300% 300% 29 * * —
Developed technology 992 22% 22% 811 12% 12% 722
Core technology 308 11% 11% 277 9% 9% 255
Customer relationships 372 59% 59% 234 56% 56% 150
Trademarks 68 41% 41% 48 30% 30% 37
Total amortization of intangible assets $ 2,428 23% 23% $ 1,973 15% 15% $ 1,713
* Not meaningful
Amortization of intangible assets increased in fiscal 2011 in comparison to fiscal 2010 primarily due to the full fiscal year’s impact from the amortization of
acquired intangible assets from Sun and, to a lesser extent, additional amortization from intangible assets that we acquired since the beginning of fiscal 2010.
These
64
Source: ORACLE CORP, 10-K, June 28, 2011 Powered by Morningstar® Document Research℠