Oracle 2010 Annual Report Download - page 163
Download and view the complete annual report
Please find page 163 of the 2010 Oracle annual report below. You can navigate through the pages in the report by either clicking on the pages listed below, or by using the keyword search tool below to find specific information within the annual report.-
 1
1 -
2
-
3
-
4
-
5
-
6
-
7
-
8
-
9
-
10
-
11
-
12
-
13
-
14
-
15
-
16
-
17
-
18
-
19
-
20
-
21
-
22
-
23
-
24
-
25
-
26
-
27
-
28
-
29
-
30
-
31
-
32
-
33
-
34
-
35
-
36
-
37
-
38
-
39
-
40
-
41
-
42
-
43
-
44
-
45
-
46
-
47
-
48
-
49
-
50
-
51
-
52
-
53
-
54
-
55
-
56
-
57
-
58
-
59
-
60
-
61
-
62
-
63
-
64
-
65
-
66
-
67
-
68
-
69
-
70
-
71
-
72
-
73
-
74
-
75
-
76
-
77
-
78
-
79
-
80
-
81
-
82
-
83
-
84
-
85
-
86
-
87
-
88
-
89
-
90
-
91
-
92
-
93
-
94
-
95
-
96
-
97
-
98
-
99
-
100
-
101
-
102
-
103
-
104
-
105
-
106
-
107
-
108
-
109
-
110
-
111
-
112
-
113
-
114
-
115
-
116
-
117
-
118
-
119
-
120
-
121
-
122
-
123
-
124
-
125
-
126
-
127
-
128
-
129
-
130
-
131
-
132
-
133
-
134
-
135
-
136
-
137
-
138
-
139
-
140
-
141
-
142
-
143
-
144
-
145
-
146
-
147
-
148
-
149
-
150
-
151
-
152
-
 153
153 -
 154
154 -
 155
155 -
 156
156 -
 157
157 -
 158
158 -
 159
159 -
 160
160 -
 161
161 -
 162
162 -
 163
163 -
 164
164 -
 165
165 -
 166
166 -
 167
167 -
 168
168 -
 169
169 -
 170
170 -
 171
171 -
 172
172 -
 173
173 -
174
-
175
-
176
-
177
-
178
-
179
-
180
-
181
-
182
-
183
-
184
-
185
-
186
-
187
-
188
-
189
-
190
-
191
-
192
-
193
-
194
-
195
-
196
-
197
-
198
-
199
-
200
-
201
-
202
-
203
-
204
-
205
-
206
-
207
-
208
-
209
-
210
-
211
-
212
-
213
-
214
-
215
-
216
-
217
-
218
-
219
-
220
-
221
-
222
-
223
-
224
-
225
-
226
-
227
-
228
-
229
-
230
-
231
-
232
-
233
-
234
-
235
-
236
-
237
-
238
-
239
-
240
-
241
-
242
-
243
-
244
-
245
-
246
-
247
-
248
-
249
-
250
-
251
-
252
-
253
-
254
-
255
-
256
-
257
-
258
-
259
-
260
-
261
-
262
-
263
-
264
-
265
-
266
-
267
-
268
-
269
-
270
-
271
-
272
 |
 |

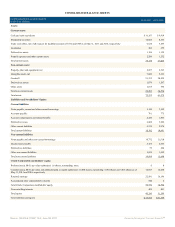
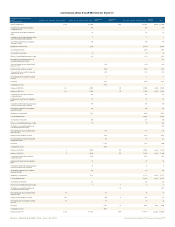
CONSOLIDATED STATEMENTS OF CASH FLOWS
CONSOLIDATED STATEMENTS OF CASH FLOWS
(USD $) (in Millions)
12 Months Ended
05/31/2011
12 Months Ended
05/31/2010
12 Months Ended
05/31/2009
Statement line items
Cash Flows From Operating Activities:
Net income $ 8,547 $ 6,135 $ 5,593
Adjustments to reconcile net income to net cash provided by operating activities:
Depreciation 368 298 263
Amortization of intangible assets 2,428 1,973 1,713
Allowances for doubtful accounts receivable 164 143 118
Deferred income taxes (253) (511) (395)
Stock-based compensation 510 436 355
Tax benefits on the exercise of stock options and vesting of restricted stock-based awards 325 203 252
Excess tax benefits on the exercise of stock options and vesting of restricted stock-based awards (215) (110) (194)
Other, net 68 13 185
Changes in operating assets and liabilities, net of effects from acquisitions:
(Increase) decrease in trade receivables (729) (362) 336
(Increase) decrease in inventories (28) 73
Decrease in prepaid expenses and other assets 14 340 145
Decrease in accounts payable and other liabilities (120) (360) (691)
(Decrease) increase in income taxes payable (96) (79) 142
Increase in deferred revenues 231 489 433
Net cash provided by operating activities 11,214 8,681 8,255
Cash Flows From Investing Activities:
Purchases of marketable securities and other investments (31,009) (15,703) (9,315)
Proceeds from maturities and sales of marketable securities and other investments 27,120 11,220 8,404
Acquisitions, net of cash acquired (1,847) (5,606) (1,159)
Capital expenditures (450) (230) (529)
Proceeds from sale of property 105
Net cash used for investing activities (6,081) (10,319) (2,599)
Cash Flows From Financing Activities:
Payments for repurchases of common stock (1,160) (992) (3,972)
Proceeds from issuances of common stock 1,376 874 760
Payments of dividends to stockholders (1,061) (1,004) (250)
Proceeds from borrowings, net of issuance costs 4,354 7,220
Repayments of borrowings (3,143) (3,582) (1,004)
Excess tax benefits on the exercise of stock options and vesting of restricted stock-based awards 215 110 194
Distributions to noncontrolling interests (65) (59) (53)
Other, net 97 (97)
Net cash provided by (used for) financing activities 516 2,664 (4,422)
Effect of exchange rate changes on cash and cash equivalents 600 (107) (501)
Net increase in cash and cash equivalents 6,249 919 733
Cash and cash equivalents at beginning of period 9,914 8,995 8,262
Cash and cash equivalents at end of period 16,163 9,914 8,995
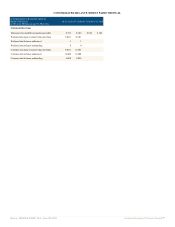
Non-cash investing and financing transactions:
Fair value of stock options and restricted stock-based awards assumed in connection with
acquisitions
17 100 1
Source: ORACLE CORP, 10-K, June 28, 2011 Powered by Morningstar® Document Research℠