Oracle 2010 Annual Report Download - page 125
Download and view the complete annual report
Please find page 125 of the 2010 Oracle annual report below. You can navigate through the pages in the report by either clicking on the pages listed below, or by using the keyword search tool below to find specific information within the annual report.-
 1
1 -
2
-
3
-
4
-
5
-
6
-
7
-
8
-
9
-
10
-
11
-
12
-
13
-
14
-
15
-
16
-
17
-
18
-
19
-
20
-
21
-
22
-
23
-
24
-
25
-
26
-
27
-
28
-
29
-
30
-
31
-
32
-
33
-
34
-
35
-
36
-
37
-
38
-
39
-
40
-
41
-
42
-
43
-
44
-
45
-
46
-
47
-
48
-
49
-
50
-
51
-
52
-
53
-
54
-
55
-
56
-
57
-
58
-
59
-
60
-
61
-
62
-
63
-
64
-
65
-
66
-
67
-
68
-
69
-
70
-
71
-
72
-
73
-
74
-
75
-
76
-
77
-
78
-
79
-
80
-
81
-
82
-
83
-
84
-
85
-
86
-
87
-
88
-
89
-
90
-
91
-
92
-
93
-
94
-
95
-
96
-
97
-
98
-
99
-
100
-
101
-
102
-
103
-
104
-
105
-
106
-
107
-
108
-
109
-
110
-
111
-
112
-
113
-
114
-
 115
115 -
 116
116 -
 117
117 -
 118
118 -
 119
119 -
 120
120 -
 121
121 -
 122
122 -
 123
123 -
 124
124 -
 125
125 -
 126
126 -
 127
127 -
 128
128 -
 129
129 -
 130
130 -
 131
131 -
 132
132 -
 133
133 -
 134
134 -
 135
135 -
136
-
137
-
138
-
139
-
140
-
141
-
142
-
143
-
144
-
145
-
146
-
147
-
148
-
149
-
150
-
151
-
152
-
153
-
154
-
155
-
156
-
157
-
158
-
159
-
160
-
161
-
162
-
163
-
164
-
165
-
166
-
167
-
168
-
169
-
170
-
171
-
172
-
173
-
174
-
175
-
176
-
177
-
178
-
179
-
180
-
181
-
182
-
183
-
184
-
185
-
186
-
187
-
188
-
189
-
190
-
191
-
192
-
193
-
194
-
195
-
196
-
197
-
198
-
199
-
200
-
201
-
202
-
203
-
204
-
205
-
206
-
207
-
208
-
209
-
210
-
211
-
212
-
213
-
214
-
215
-
216
-
217
-
218
-
219
-
220
-
221
-
222
-
223
-
224
-
225
-
226
-
227
-
228
-
229
-
230
-
231
-
232
-
233
-
234
-
235
-
236
-
237
-
238
-
239
-
240
-
241
-
242
-
243
-
244
-
245
-
246
-
247
-
248
-
249
-
250
-
251
-
252
-
253
-
254
-
255
-
256
-
257
-
258
-
259
-
260
-
261
-
262
-
263
-
264
-
265
-
266
-
267
-
268
-
269
-
270
-
271
-
272
 |
 |

Table of Contents
ORACLE CORPORATION
NOTES TO CONSOLIDATED FINANCIAL STATEMENTS—(Continued)
May 31, 2011
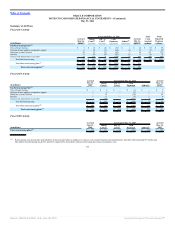
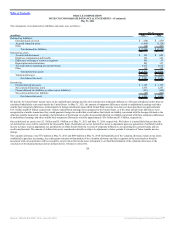
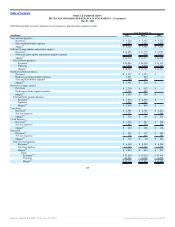
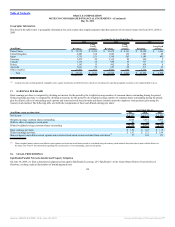
Stock-Based Compensation Expense and Valuation of Stock Options and Restricted Stock-Based Awards
Stock-based compensation is included in the following operating expense line items in our consolidated statements of operations:
Year Ended May 31,
(in millions) 2011 2010 2009
Sales and marketing $ 87 $ 81 $ 67
Software license updates and product support 14 17 13
Hardware systems products 2 3 —
Hardware systems support 5 2 —
Services 16 14 12
Research and development 231 172 155
General and administrative 145 132 93
Acquisition related and other 10 15 15
Total stock-based compensation 510 436 355
Estimated income tax benefit included in provision for income taxes (170) (146) (122)
Total stock-based compensation, net of estimated income tax benefit $ 340 $ 290 $ 233
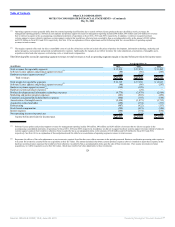
We estimate the fair value of our share-based payments using the Black-Scholes-Merton option-pricing model, which was developed for use in estimating the fair
value of stock options. Option valuation models, including the Black-Scholes-Merton option-pricing model, require the input of assumptions, including stock
price volatility. Changes in the input assumptions can materially affect the fair value estimates and ultimately how much we recognize as stock-based
compensation expense. The fair values of our stock options were estimated at the date of grant or date of acquisition for options assumed in a business
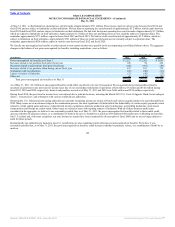
combination. The weighted average input assumptions used and resulting fair values were as follows for fiscal 2011, 2010 and 2009:
Year Ended May 31,
2011 2010 2009
Expected life (in years) 5.1 4.7 5.3
Risk-free interest rate 1.8% 2.1% 3.3%
Volatility 33% 31% 37%
Dividend yield 0.9% 0.9% —
Weighted-average fair value per share $ 6.61 $ 5.21 $ 7.93
The expected life input is based on historical exercise patterns and post-vesting termination behavior, the risk-free interest rate input is based on United States
Treasury instruments and the volatility input is calculated based on the implied volatility of our longest-term, traded options. Our expected dividend yield was
zero prior to our first dividend declaration on March 18, 2009 as we did not historically pay cash dividends on our common stock and did not anticipate doing so
for the foreseeable future for grants issued prior to March 18, 2009. For grants issued subsequent to March 18, 2009, we used an annualized dividend yield based
on the per share dividend declared by our Board of Directors.
Tax Benefits from Exercise of Stock Options and Vesting of Restricted Stock-Based Awards
Total cash received as a result of option exercises was approximately $1.3 billion, $812 million and $696 million for fiscal 2011, 2010 and 2009, respectively.
The aggregate intrinsic value of options exercised and vesting of restricted stock-based awards was $1.1 billion, $647 million and $807 million for fiscal 2011,
2010 and 2009, respectively. In connection with these exercises and vesting of restricted stock-based awards, the tax benefits realized by us were $325 million,
$203 million and $252 million for fiscal 2011, 2010 and 2009, respectively. Of
121
Source: ORACLE CORP, 10-K, June 28, 2011 Powered by Morningstar® Document Research℠