Oracle 2010 Annual Report Download - page 72
Download and view the complete annual report
Please find page 72 of the 2010 Oracle annual report below. You can navigate through the pages in the report by either clicking on the pages listed below, or by using the keyword search tool below to find specific information within the annual report.-
 1
1 -
2
-
3
-
4
-
5
-
6
-
7
-
8
-
9
-
10
-
11
-
12
-
13
-
14
-
15
-
16
-
17
-
18
-
19
-
20
-
21
-
22
-
23
-
24
-
25
-
26
-
27
-
28
-
29
-
30
-
31
-
32
-
33
-
34
-
35
-
36
-
37
-
38
-
39
-
40
-
41
-
42
-
43
-
44
-
45
-
46
-
47
-
48
-
49
-
50
-
51
-
52
-
53
-
54
-
55
-
56
-
57
-
58
-
59
-
60
-
61
-
 62
62 -
 63
63 -
 64
64 -
 65
65 -
 66
66 -
 67
67 -
 68
68 -
 69
69 -
 70
70 -
 71
71 -
 72
72 -
 73
73 -
 74
74 -
 75
75 -
 76
76 -
 77
77 -
 78
78 -
 79
79 -
 80
80 -
 81
81 -
 82
82 -
83
-
84
-
85
-
86
-
87
-
88
-
89
-
90
-
91
-
92
-
93
-
94
-
95
-
96
-
97
-
98
-
99
-
100
-
101
-
102
-
103
-
104
-
105
-
106
-
107
-
108
-
109
-
110
-
111
-
112
-
113
-
114
-
115
-
116
-
117
-
118
-
119
-
120
-
121
-
122
-
123
-
124
-
125
-
126
-
127
-
128
-
129
-
130
-
131
-
132
-
133
-
134
-
135
-
136
-
137
-
138
-
139
-
140
-
141
-
142
-
143
-
144
-
145
-
146
-
147
-
148
-
149
-
150
-
151
-
152
-
153
-
154
-
155
-
156
-
157
-
158
-
159
-
160
-
161
-
162
-
163
-
164
-
165
-
166
-
167
-
168
-
169
-
170
-
171
-
172
-
173
-
174
-
175
-
176
-
177
-
178
-
179
-
180
-
181
-
182
-
183
-
184
-
185
-
186
-
187
-
188
-
189
-
190
-
191
-
192
-
193
-
194
-
195
-
196
-
197
-
198
-
199
-
200
-
201
-
202
-
203
-
204
-
205
-
206
-
207
-
208
-
209
-
210
-
211
-
212
-
213
-
214
-
215
-
216
-
217
-
218
-
219
-
220
-
221
-
222
-
223
-
224
-
225
-
226
-
227
-
228
-
229
-
230
-
231
-
232
-
233
-
234
-
235
-
236
-
237
-
238
-
239
-
240
-
241
-
242
-
243
-
244
-
245
-
246
-
247
-
248
-
249
-
250
-
251
-
252
-
253
-
254
-
255
-
256
-
257
-
258
-
259
-
260
-
261
-
262
-
263
-
264
-
265
-
266
-
267
-
268
-
269
-
270
-
271
-
272
 |
 |

Table of Contents
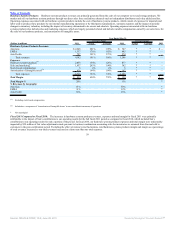
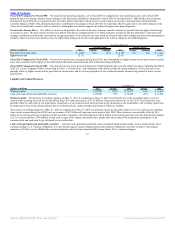
corporate notes, U.S. Treasury obligations, U.S. government agency and government sponsored enterprise obligations and certain other securities. The increase
in cash, cash equivalents and marketable securities at May 31, 2011 in comparison to May 31, 2010 was primarily due to cash generated from our operating
activities, our issuance of $3.25 billion of senior notes in July 2010 and $1.15 billion of short-term borrowings made pursuant to certain of our revolving credit
agreements. Cash, cash equivalents and marketable securities included $20.4 billion held by our foreign subsidiaries as of May 31, 2011, $16.1 billion of which
we consider indefinitely reinvested earnings outside the United States. These undistributed earnings would be subject to U.S. income tax if repatriated to the
United States. Assuming a full utilization of the foreign tax credits, the potential deferred tax liability associated with these undistributed earnings would be
approximately $4.6 billion. The amount of cash, cash equivalents and marketable securities that we report in U.S. Dollars for a significant portion of the cash
held by these subsidiaries is subject to translation adjustments caused by changes in foreign currency exchange rates as of the end of each respective reporting
period (the offset to which is recorded to accumulated other comprehensive income in our consolidated balance sheet). As the U.S. Dollar generally weakened
against certain major international currencies during fiscal 2011, the amount of cash, cash equivalents and marketable securities that we reported in U.S. Dollars
for these subsidiaries increased as of May 31, 2011 relative to what we would have reported using constant currency rates as of May 31, 2010. The
aforementioned increases in our cash, cash equivalents and marketable securities balances were partially offset by the repayment of $2.25 billion of our senior
notes which matured in January 2011, the repayment of $881 million of commercial paper notes, the usage of $1.9 billion of net cash for acquisitions,
repurchases of our common stock, and the payments of cash dividends to our stockholders.
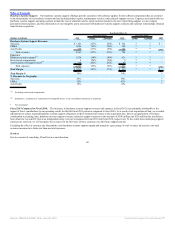
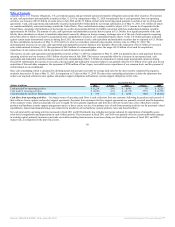
The increase in cash, cash equivalents and marketable securities at May 31, 2010 in comparison to May 31, 2009 was primarily due to cash generated from our
operating activities and our issuance of $4.5 billion of senior notes in July 2009. The increase was partially offset by a decrease in our reported cash, cash
equivalents and marketable securities balances caused by the strengthening of the U.S. Dollar in comparison to certain major international currencies during
fiscal 2010. Additionally, the increase in our cash, cash equivalents and marketable securities balances was partially offset by $5.6 billion of net cash used for our
acquisition of Sun and other companies, the repayment of $700 million of Sun’s legacy convertible notes, repurchases of our common stock, and the payment of
cash dividends to our stockholders.
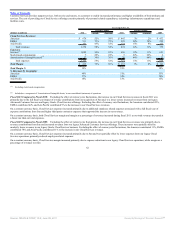
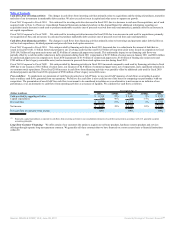
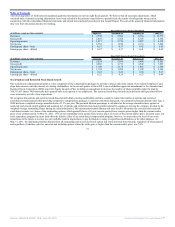
Days sales outstanding, which is calculated by dividing period end accounts receivable by average daily sales for the most recently completed fiscal quarter,
modestly increased to 55 days at May 31, 2011 in comparison to 53 days at May 31, 2010. The days sales outstanding calculation excludes the adjustment that
reduces our acquired software license updates and product support obligations and hardware systems support obligations to fair value.
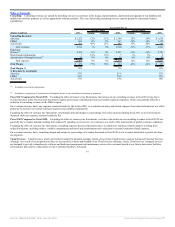
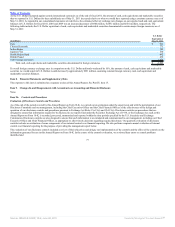
Year Ended May 31,
(Dollars in millions) 2011 Change 2010 Change 2009
Cash provided by operating activities $ 11,214 29% $ 8,681 5% $ 8,255
Cash used for investing activities $ (6,081) -41% $ (10,319) 297% $ (2,599)
Cash provided by (used for) financing activities $ 516 -81% $ 2,664 -160% $ (4,422)
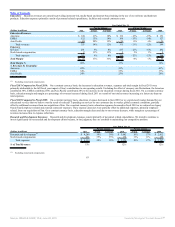
Cash flows from operating activities: Our largest source of operating cash flows is cash collections from our customers following the purchase and renewal of
their software license updates and product support agreements. Payments from customers for these support agreements are generally received near the beginning
of the contracts’ terms, which are generally one year in length. We also generate significant cash from new software license sales, sales of hardware systems
products and hardware systems support arrangements and, to a lesser extent, services. Our primary uses of cash from operating activities are for personnel related
expenditures, material and manufacturing costs related to the production of our hardware systems products, taxes and leased facilities.
Net cash provided by operating activities increased in fiscal 2011 and 2010 primarily due to higher net income adjusted for amortization of intangible assets,
stock-based compensation and depreciation in each of these periods. These increases in fiscal 2011 and 2010 were partially offset by certain unfavorable changes
in working capital, primarily increases in net trade receivables resulting from increases in revenues during our fiscal fourth quarters of fiscal 2011 and 2010,
respectively, in comparison to the prior fiscal years.
68
Source: ORACLE CORP, 10-K, June 28, 2011 Powered by Morningstar® Document Research℠