Oracle 2010 Annual Report Download - page 59
Download and view the complete annual report
Please find page 59 of the 2010 Oracle annual report below. You can navigate through the pages in the report by either clicking on the pages listed below, or by using the keyword search tool below to find specific information within the annual report.-
 1
1 -
2
-
3
-
4
-
5
-
6
-
7
-
8
-
9
-
10
-
11
-
12
-
13
-
14
-
15
-
16
-
17
-
18
-
19
-
20
-
21
-
22
-
23
-
24
-
25
-
26
-
27
-
28
-
29
-
30
-
31
-
32
-
33
-
34
-
35
-
36
-
37
-
38
-
39
-
40
-
41
-
42
-
43
-
44
-
45
-
46
-
47
-
48
-
 49
49 -
 50
50 -
 51
51 -
 52
52 -
 53
53 -
 54
54 -
 55
55 -
 56
56 -
 57
57 -
 58
58 -
 59
59 -
 60
60 -
 61
61 -
 62
62 -
 63
63 -
 64
64 -
 65
65 -
 66
66 -
 67
67 -
 68
68 -
 69
69 -
70
-
71
-
72
-
73
-
74
-
75
-
76
-
77
-
78
-
79
-
80
-
81
-
82
-
83
-
84
-
85
-
86
-
87
-
88
-
89
-
90
-
91
-
92
-
93
-
94
-
95
-
96
-
97
-
98
-
99
-
100
-
101
-
102
-
103
-
104
-
105
-
106
-
107
-
108
-
109
-
110
-
111
-
112
-
113
-
114
-
115
-
116
-
117
-
118
-
119
-
120
-
121
-
122
-
123
-
124
-
125
-
126
-
127
-
128
-
129
-
130
-
131
-
132
-
133
-
134
-
135
-
136
-
137
-
138
-
139
-
140
-
141
-
142
-
143
-
144
-
145
-
146
-
147
-
148
-
149
-
150
-
151
-
152
-
153
-
154
-
155
-
156
-
157
-
158
-
159
-
160
-
161
-
162
-
163
-
164
-
165
-
166
-
167
-
168
-
169
-
170
-
171
-
172
-
173
-
174
-
175
-
176
-
177
-
178
-
179
-
180
-
181
-
182
-
183
-
184
-
185
-
186
-
187
-
188
-
189
-
190
-
191
-
192
-
193
-
194
-
195
-
196
-
197
-
198
-
199
-
200
-
201
-
202
-
203
-
204
-
205
-
206
-
207
-
208
-
209
-
210
-
211
-
212
-
213
-
214
-
215
-
216
-
217
-
218
-
219
-
220
-
221
-
222
-
223
-
224
-
225
-
226
-
227
-
228
-
229
-
230
-
231
-
232
-
233
-
234
-
235
-
236
-
237
-
238
-
239
-
240
-
241
-
242
-
243
-
244
-
245
-
246
-
247
-
248
-
249
-
250
-
251
-
252
-
253
-
254
-
255
-
256
-
257
-
258
-
259
-
260
-
261
-
262
-
263
-
264
-
265
-
266
-
267
-
268
-
269
-
270
-
271
-
272
 |
 |
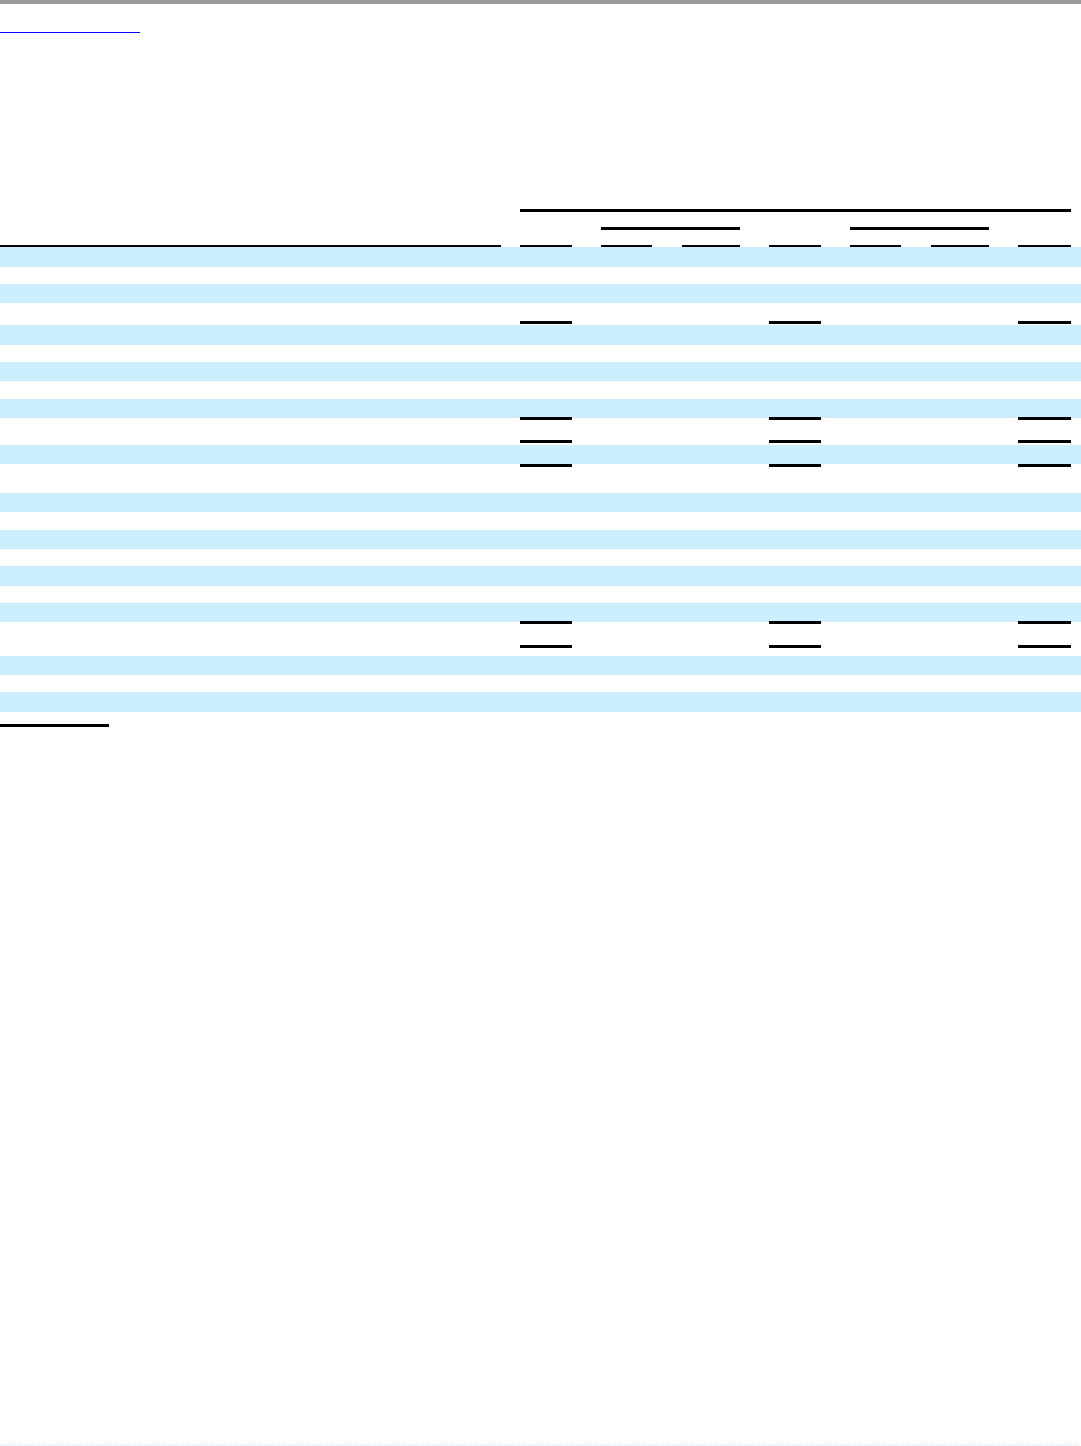
Table of Contents
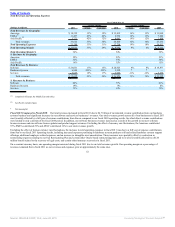
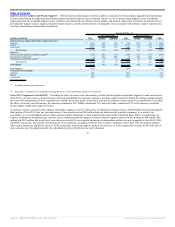
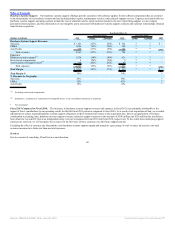
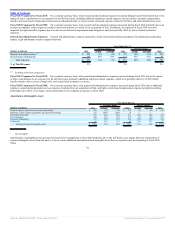
Software Business
Our software business consists of our new software licenses segment and software license updates and product support segment.
New Software Licenses: New software license revenues represent fees earned from granting customers licenses to use our database and middleware as well as
our application software products. We continue to place significant emphasis, both domestically and internationally, on direct sales through our own sales force.
We also continue to market our products through indirect channels. Sales and marketing expenses are largely personnel related and include commissions earned
by our sales force for the sale of our software products, and also include marketing program costs and amortization of intangible assets.
Year Ended May 31,
Percent Change Percent Change
(Dollars in millions) 2011 Actual Constant 2010 Actual Constant 2009
New Software License Revenues:
Americas $ 4,662 26% 24% $ 3,704 15% 14% $ 3,216
EMEA 2,861 16% 13% 2,463 -5% -4% 2,589
Asia Pacific 1,712 25% 16% 1,366 4% -3% 1,318
Total revenues 9,235 23% 19% 7,533 6% 4% 7,123
Expenses:
Sales and marketing(1) 5,455 17% 16% 4,654 2% 1% 4,571
Stock-based compensation 84 5% 5% 79 17% 17% 67
Amortization of intangible assets(2) 811 0% 0% 816 0% 0% 819
Total expenses 6,350 14% 13% 5,549 2% 1% 5,457
Total Margin $ 2,885 45% 37% $ 1,984 19% 15% $ 1,666
Total Margin % 31% 26% 23%
% Revenues by Geography:
Americas 50% 49% 45%
EMEA 31% 33% 36%
Asia Pacific 19% 18% 19%
Revenues by Product:
Database and middleware $ 6,626 23% 19% $ 5,406 6% 4% $ 5,123
Applications 2,609 23% 20% 2,127 6% 5% 2,000
Total new software license revenues $ 9,235 23% 19% $ 7,533 6% 4% $ 7,123
% Revenues by Product:
Database and middleware 72% 72% 72%
Applications 28% 28% 28%
(1) Excluding stock-based compensation
(2) Included as a component of ‘Amortization of Intangible Assets’ in our consolidated statements of operations
Fiscal 2011 Compared to Fiscal 2010: Excluding the effect of favorable foreign currency rate fluctuations of 4 percentage points, total new software license
revenues increased by 19% in fiscal 2011 due to growth across all major regions and product types and incremental revenues from our acquisitions. On a
constant currency basis, the Americas contributed 63%, EMEA contributed 21% and Asia Pacific contributed 16% to our new software license revenues growth
during fiscal 2011.
In constant currency, database and middleware revenues and applications revenues increased by 19% and 20%, respectively, in fiscal 2011 primarily due to
growth resulting from improved customer demand, our sales force’s execution and incremental revenues from our acquisitions. In reported currency, Sun
contributed $398 million in growth to our database and middleware revenues through the third quarter of fiscal 2011 (the one year anniversary of our acquisition)
and our other recent acquisitions contributed $40 million during fiscal 2011. In reported currency, our recent acquisitions contributed $191 million to the growth
in our applications revenues during fiscal 2011.
55
Source: ORACLE CORP, 10-K, June 28, 2011 Powered by Morningstar® Document Research℠