Oracle 2010 Annual Report Download - page 65
Download and view the complete annual report
Please find page 65 of the 2010 Oracle annual report below. You can navigate through the pages in the report by either clicking on the pages listed below, or by using the keyword search tool below to find specific information within the annual report.-
 1
1 -
2
-
3
-
4
-
5
-
6
-
7
-
8
-
9
-
10
-
11
-
12
-
13
-
14
-
15
-
16
-
17
-
18
-
19
-
20
-
21
-
22
-
23
-
24
-
25
-
26
-
27
-
28
-
29
-
30
-
31
-
32
-
33
-
34
-
35
-
36
-
37
-
38
-
39
-
40
-
41
-
42
-
43
-
44
-
45
-
46
-
47
-
48
-
49
-
50
-
51
-
52
-
53
-
54
-
 55
55 -
 56
56 -
 57
57 -
 58
58 -
 59
59 -
 60
60 -
 61
61 -
 62
62 -
 63
63 -
 64
64 -
 65
65 -
 66
66 -
 67
67 -
 68
68 -
 69
69 -
 70
70 -
 71
71 -
 72
72 -
 73
73 -
 74
74 -
 75
75 -
76
-
77
-
78
-
79
-
80
-
81
-
82
-
83
-
84
-
85
-
86
-
87
-
88
-
89
-
90
-
91
-
92
-
93
-
94
-
95
-
96
-
97
-
98
-
99
-
100
-
101
-
102
-
103
-
104
-
105
-
106
-
107
-
108
-
109
-
110
-
111
-
112
-
113
-
114
-
115
-
116
-
117
-
118
-
119
-
120
-
121
-
122
-
123
-
124
-
125
-
126
-
127
-
128
-
129
-
130
-
131
-
132
-
133
-
134
-
135
-
136
-
137
-
138
-
139
-
140
-
141
-
142
-
143
-
144
-
145
-
146
-
147
-
148
-
149
-
150
-
151
-
152
-
153
-
154
-
155
-
156
-
157
-
158
-
159
-
160
-
161
-
162
-
163
-
164
-
165
-
166
-
167
-
168
-
169
-
170
-
171
-
172
-
173
-
174
-
175
-
176
-
177
-
178
-
179
-
180
-
181
-
182
-
183
-
184
-
185
-
186
-
187
-
188
-
189
-
190
-
191
-
192
-
193
-
194
-
195
-
196
-
197
-
198
-
199
-
200
-
201
-
202
-
203
-
204
-
205
-
206
-
207
-
208
-
209
-
210
-
211
-
212
-
213
-
214
-
215
-
216
-
217
-
218
-
219
-
220
-
221
-
222
-
223
-
224
-
225
-
226
-
227
-
228
-
229
-
230
-
231
-
232
-
233
-
234
-
235
-
236
-
237
-
238
-
239
-
240
-
241
-
242
-
243
-
244
-
245
-
246
-
247
-
248
-
249
-
250
-
251
-
252
-
253
-
254
-
255
-
256
-
257
-
258
-
259
-
260
-
261
-
262
-
263
-
264
-
265
-
266
-
267
-
268
-
269
-
270
-
271
-
272
 |
 |

Table of Contents
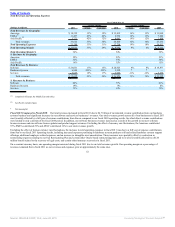
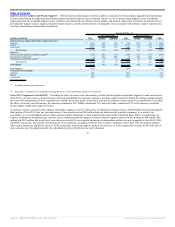
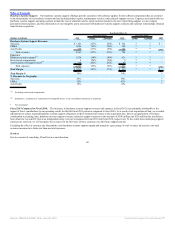
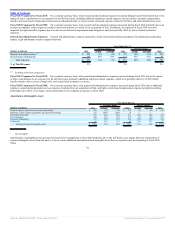
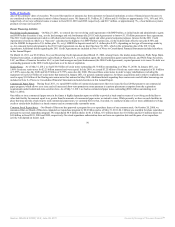
Consulting: Consulting revenues are earned by providing services to customers in the design, implementation, deployment and upgrade of our database and
middleware software products as well as applications software products. The cost of providing consulting services consists primarily of personnel related
expenditures.
Year Ended May 31,
2011
Percent Change
2010
Percent Change
2009
(Dollars in millions) Actual Constant Actual Constant
Consulting Revenues:
Americas $ 1,552 12% 11% $ 1,390 -15% -16% $ 1,639
EMEA 860 -9% -9% 943 -18% -18% 1,152
Asia Pacific 502 30% 21% 387 -15% -20% 456
Total revenues 2,914 7% 6% 2,720 -16% -17% 3,247
Expenses:
Services(1) 2,439 0% 0% 2,431 -13% -14% 2,781
Stock-based compensation 7 12% 12% 7 1% 1% 6
Amortization of intangible assets(2) 39 0% 0% 38 -5% -5% 40
Total expenses 2,485 0% 0% 2,476 -12% -13% 2,827
Total Margin $ 429 77% 68% $ 244 -42% -44% $ 420
Total Margin % 15% 9% 13%
% Revenues by Geography:
Americas 53% 51% 51%
EMEA 30% 35% 35%
Asia Pacific 17% 14% 14%
(1) Excluding stock-based compensation
(2) Included as a component of ‘Amortization of Intangible Assets’ in our consolidated statements of operations
Fiscal 2011 Compared to Fiscal 2010: Excluding the effect of currency rate fluctuations, the increase in our consulting revenues in fiscal 2011 was due to
revenue increases in the Americas and Asia Pacific regions and revenue contributions from our recently acquired companies, which were partially offset by a
reduction in consulting revenues in the EMEA region.
On a constant currency basis, our expenses remained relatively flat in fiscal 2011 as a reduction in salary and related expenses from reduced headcount was offset
primarily by increases in external contractor expenses and variable compensation.
Excluding the effect of currency rate fluctuations, total margin and total margin as a percentage of revenues increased during fiscal 2011 as our total revenues
increased while our expenses remained relatively flat.
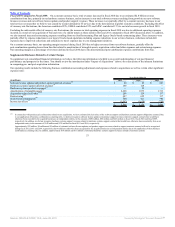
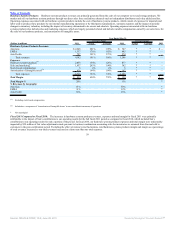
Fiscal 2010 Compared to Fiscal 2009: Excluding the effect of currency rate fluctuations, we believe the decline in our consulting revenues in fiscal 2010 was
generally due to weaker demand resulting from reduced IT spending on services by our customers as a result of the deterioration of global economic conditions.
Excluding the effect of currency rate fluctuations, consulting expenses decreased primarily due to a reduction in employee related expenses resulting from
reduced headcount, including salaries, variable compensation and travel and entertainment and a reduction in external contractor related expenses.
On a constant currency basis, consulting margin and margin as a percentage of revenues decreased in fiscal 2010 as our revenues declined at a greater rate than
our expenses.
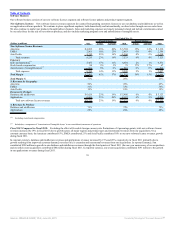
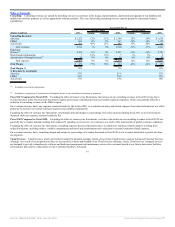
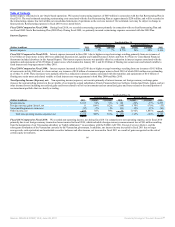
Cloud Services: Cloud Services, which was formerly named On Demand, includes certain of our Oracle Cloud Services and our Advanced Customer Services
offerings. As a result of our acquisition of Sun, we increased the volume and breadth of our Cloud Services offerings. Oracle Cloud Services’ managed services
are designed to provide comprehensive software and hardware management and maintenance services for customers hosted at our Oracle data center facilities,
select partner data centers or physically on-site at customer facilities. Advanced
61
Source: ORACLE CORP, 10-K, June 28, 2011 Powered by Morningstar® Document Research℠