Oracle 2010 Annual Report Download - page 73
Download and view the complete annual report
Please find page 73 of the 2010 Oracle annual report below. You can navigate through the pages in the report by either clicking on the pages listed below, or by using the keyword search tool below to find specific information within the annual report.-
 1
1 -
2
-
3
-
4
-
5
-
6
-
7
-
8
-
9
-
10
-
11
-
12
-
13
-
14
-
15
-
16
-
17
-
18
-
19
-
20
-
21
-
22
-
23
-
24
-
25
-
26
-
27
-
28
-
29
-
30
-
31
-
32
-
33
-
34
-
35
-
36
-
37
-
38
-
39
-
40
-
41
-
42
-
43
-
44
-
45
-
46
-
47
-
48
-
49
-
50
-
51
-
52
-
53
-
54
-
55
-
56
-
57
-
58
-
59
-
60
-
61
-
62
-
 63
63 -
 64
64 -
 65
65 -
 66
66 -
 67
67 -
 68
68 -
 69
69 -
 70
70 -
 71
71 -
 72
72 -
 73
73 -
 74
74 -
 75
75 -
 76
76 -
 77
77 -
 78
78 -
 79
79 -
 80
80 -
 81
81 -
 82
82 -
 83
83 -
84
-
85
-
86
-
87
-
88
-
89
-
90
-
91
-
92
-
93
-
94
-
95
-
96
-
97
-
98
-
99
-
100
-
101
-
102
-
103
-
104
-
105
-
106
-
107
-
108
-
109
-
110
-
111
-
112
-
113
-
114
-
115
-
116
-
117
-
118
-
119
-
120
-
121
-
122
-
123
-
124
-
125
-
126
-
127
-
128
-
129
-
130
-
131
-
132
-
133
-
134
-
135
-
136
-
137
-
138
-
139
-
140
-
141
-
142
-
143
-
144
-
145
-
146
-
147
-
148
-
149
-
150
-
151
-
152
-
153
-
154
-
155
-
156
-
157
-
158
-
159
-
160
-
161
-
162
-
163
-
164
-
165
-
166
-
167
-
168
-
169
-
170
-
171
-
172
-
173
-
174
-
175
-
176
-
177
-
178
-
179
-
180
-
181
-
182
-
183
-
184
-
185
-
186
-
187
-
188
-
189
-
190
-
191
-
192
-
193
-
194
-
195
-
196
-
197
-
198
-
199
-
200
-
201
-
202
-
203
-
204
-
205
-
206
-
207
-
208
-
209
-
210
-
211
-
212
-
213
-
214
-
215
-
216
-
217
-
218
-
219
-
220
-
221
-
222
-
223
-
224
-
225
-
226
-
227
-
228
-
229
-
230
-
231
-
232
-
233
-
234
-
235
-
236
-
237
-
238
-
239
-
240
-
241
-
242
-
243
-
244
-
245
-
246
-
247
-
248
-
249
-
250
-
251
-
252
-
253
-
254
-
255
-
256
-
257
-
258
-
259
-
260
-
261
-
262
-
263
-
264
-
265
-
266
-
267
-
268
-
269
-
270
-
271
-
272
 |
 |
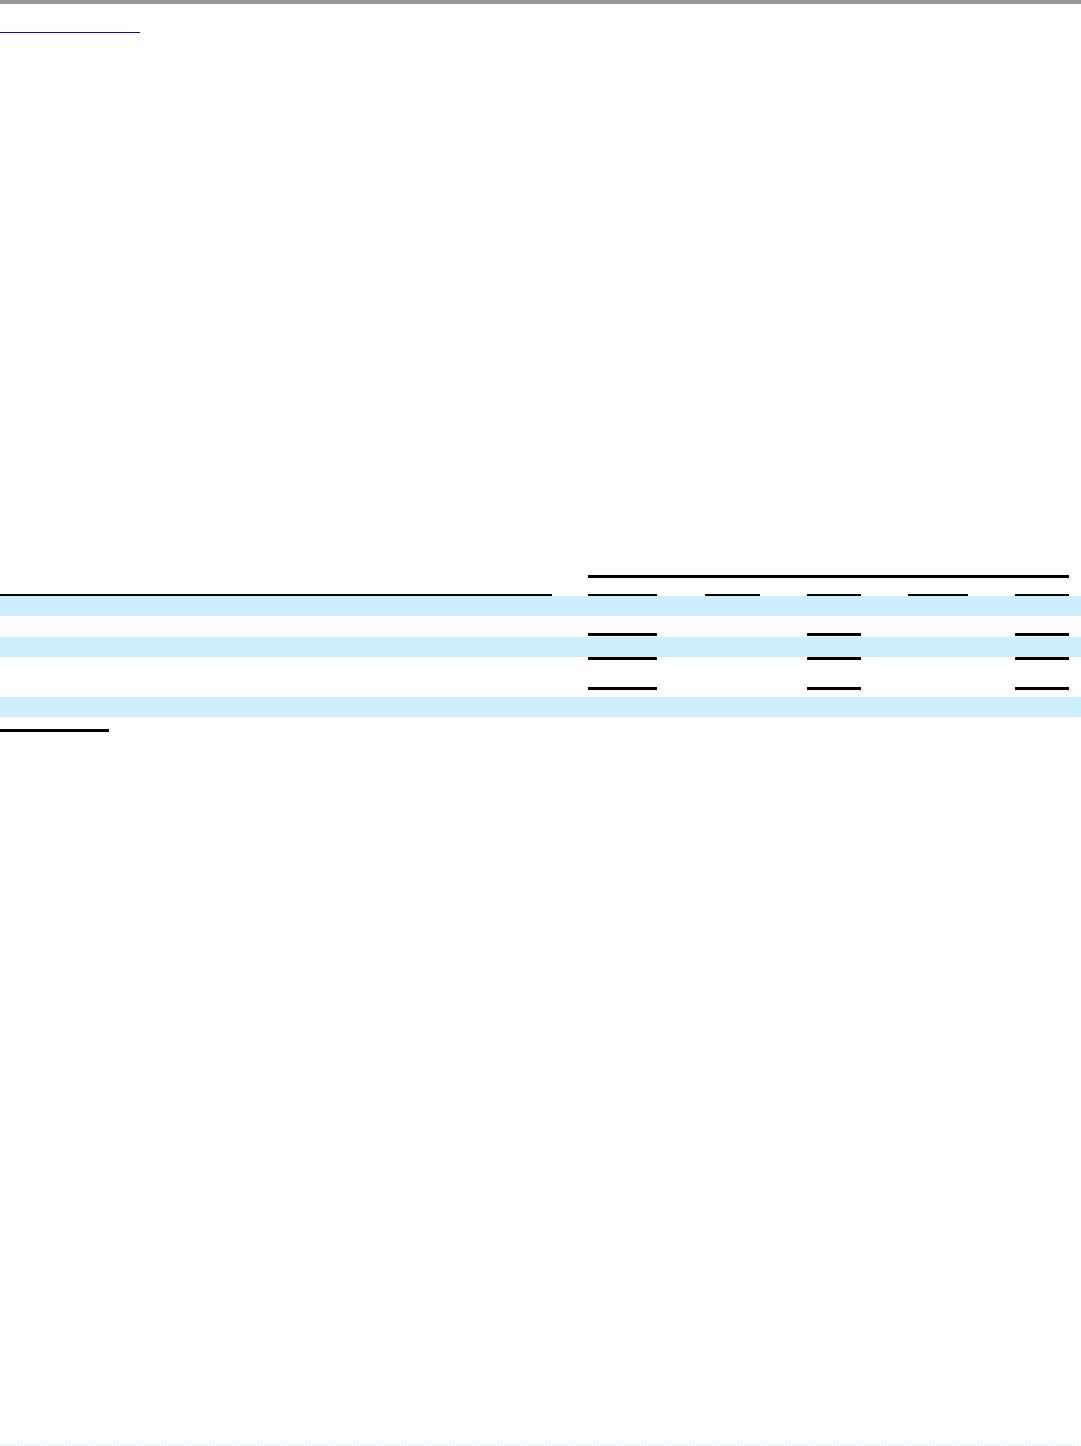
Table of Contents
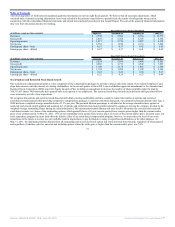
Cash flows from investing activities: The changes in cash flows from investing activities primarily relate to acquisitions and the timing of purchases, maturities
and sales of our investments in marketable debt securities. We also use cash to invest in capital and other assets to support our growth.
Fiscal 2011 Compared to Fiscal 2010: Net cash used for investing activities decreased in fiscal 2011 due to a decrease in cash used for acquisitions, net of cash
acquired (refer to Note 2 of Notes to Consolidated Financial Statements included elsewhere in this Annual Report for additional information regarding our
acquisitions) and a decrease in cash used to purchase marketable securities (net of proceeds received from sales and maturities), partially offset by an increase in
net capital expenditures.
Fiscal 2010 Compared to Fiscal 2009: Net cash used for investing activities increased in fiscal 2010 due to an increase in cash used for acquisitions, primarily
our acquisition of Sun, and an increase in cash used to purchase marketable debt securities (net of proceeds received from sales and maturities).
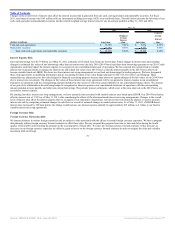
Cash flows from financing activities: The changes in cash flows from financing activities primarily relate to borrowings and payments under debt facilities as
well as stock repurchases, dividend payments and proceeds from stock option exercises.
Fiscal 2011 Compared to Fiscal 2010: Net cash provided by financing activities in fiscal 2011 decreased due to a reduction in the amount of debt that we
issued in fiscal 2011 ($1.15 billion borrowed pursuant to our revolving credit facilities and $3.25 billion of long-term senior notes issued) in comparison to fiscal
2010 ($4.5 billion of long-term senior notes and $2.8 billion of commercial paper notes issued). This unfavorable impact to our financing cash flows was
partially offset by a cash favorable reduction in debt repayments during fiscal 2011 (repayments of $2.25 billion of senior notes in January 2011 and $881 million
of commercial paper notes) in comparison to fiscal 2010 (repayments of $1.9 billion of commercial paper notes, $1.0 billion of floating rate senior notes and
$700 million of Sun’s legacy convertible notes) and an increase in proceeds from stock option exercises during fiscal 2011.
Fiscal 2010 Compared to Fiscal 2009: Net cash provided by financing activities in fiscal 2010 increased compared to cash used by financing activities in fiscal
2009 due to our issuance of $4.5 billion of senior notes, our issuances of $2.8 billion of commercial paper notes, net of repayments, and a significant reduction in
our common stock repurchases. These fiscal 2010 increases in cash flows from financing activities were partially offset by additional cash used for fiscal 2010
dividend payments and the fiscal 2010 repayment of $700 million of Sun’s legacy convertible notes.
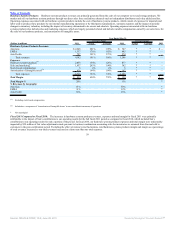
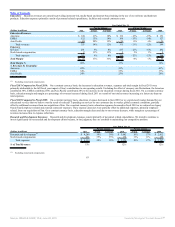
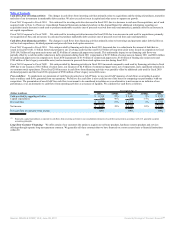
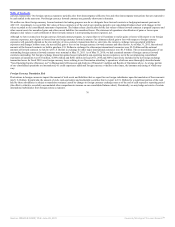
Free cash flow: To supplement our statements of cash flows presented on a GAAP basis, we use non-GAAP measures of cash flows on a trailing 4-quarter
basis to analyze cash flows generated from our operations. We believe free cash flow is also useful as one of the bases for comparing our performance with our
competitors. The presentation of non-GAAP free cash flow is not meant to be considered in isolation or as an alternative to net income as an indicator of our
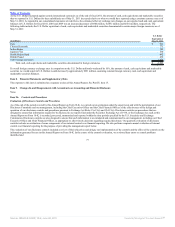
performance, or as an alternative to cash flows from operating activities as a measure of liquidity. We calculate free cash flows as follows:
Year Ended May 31,
(Dollars in millions) 2011 Change 2010 Change 2009
Cash provided by operating activities $ 11,214 29% $ 8,681 5% $ 8,255
Capital expenditures(1) (450) 96% (230) -57% (529)
Free cash flow $ 10,764 27% $ 8,451 9% $ 7,726
Net income $ 8,547 39% $ 6,135 10% $ 5,593
Free cash flow as a percent of net income 126% 138% 138%
(1) Represents capital expenditures as reported in cash flows from investing activities in our consolidated statements of cash flows presented in accordance with U.S. generally accepted
accounting principles.
Long-Term Customer Financing: We offer certain of our customers the option to acquire our software products, hardware systems products and services
offerings through separate long-term payment contracts. We generally sell these contracts that we have financed on a non-recourse basis to financial institutions
within 90
69
Source: ORACLE CORP, 10-K, June 28, 2011 Powered by Morningstar® Document Research℠