Oracle 2010 Annual Report Download - page 66
Download and view the complete annual report
Please find page 66 of the 2010 Oracle annual report below. You can navigate through the pages in the report by either clicking on the pages listed below, or by using the keyword search tool below to find specific information within the annual report.-
 1
1 -
2
-
3
-
4
-
5
-
6
-
7
-
8
-
9
-
10
-
11
-
12
-
13
-
14
-
15
-
16
-
17
-
18
-
19
-
20
-
21
-
22
-
23
-
24
-
25
-
26
-
27
-
28
-
29
-
30
-
31
-
32
-
33
-
34
-
35
-
36
-
37
-
38
-
39
-
40
-
41
-
42
-
43
-
44
-
45
-
46
-
47
-
48
-
49
-
50
-
51
-
52
-
53
-
54
-
55
-
 56
56 -
 57
57 -
 58
58 -
 59
59 -
 60
60 -
 61
61 -
 62
62 -
 63
63 -
 64
64 -
 65
65 -
 66
66 -
 67
67 -
 68
68 -
 69
69 -
 70
70 -
 71
71 -
 72
72 -
 73
73 -
 74
74 -
 75
75 -
 76
76 -
77
-
78
-
79
-
80
-
81
-
82
-
83
-
84
-
85
-
86
-
87
-
88
-
89
-
90
-
91
-
92
-
93
-
94
-
95
-
96
-
97
-
98
-
99
-
100
-
101
-
102
-
103
-
104
-
105
-
106
-
107
-
108
-
109
-
110
-
111
-
112
-
113
-
114
-
115
-
116
-
117
-
118
-
119
-
120
-
121
-
122
-
123
-
124
-
125
-
126
-
127
-
128
-
129
-
130
-
131
-
132
-
133
-
134
-
135
-
136
-
137
-
138
-
139
-
140
-
141
-
142
-
143
-
144
-
145
-
146
-
147
-
148
-
149
-
150
-
151
-
152
-
153
-
154
-
155
-
156
-
157
-
158
-
159
-
160
-
161
-
162
-
163
-
164
-
165
-
166
-
167
-
168
-
169
-
170
-
171
-
172
-
173
-
174
-
175
-
176
-
177
-
178
-
179
-
180
-
181
-
182
-
183
-
184
-
185
-
186
-
187
-
188
-
189
-
190
-
191
-
192
-
193
-
194
-
195
-
196
-
197
-
198
-
199
-
200
-
201
-
202
-
203
-
204
-
205
-
206
-
207
-
208
-
209
-
210
-
211
-
212
-
213
-
214
-
215
-
216
-
217
-
218
-
219
-
220
-
221
-
222
-
223
-
224
-
225
-
226
-
227
-
228
-
229
-
230
-
231
-
232
-
233
-
234
-
235
-
236
-
237
-
238
-
239
-
240
-
241
-
242
-
243
-
244
-
245
-
246
-
247
-
248
-
249
-
250
-
251
-
252
-
253
-
254
-
255
-
256
-
257
-
258
-
259
-
260
-
261
-
262
-
263
-
264
-
265
-
266
-
267
-
268
-
269
-
270
-
271
-
272
 |
 |

Table of Contents
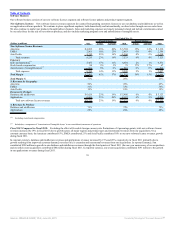
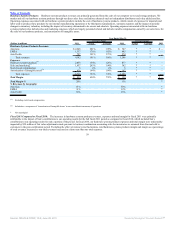
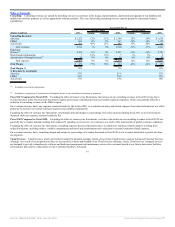
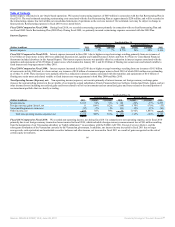
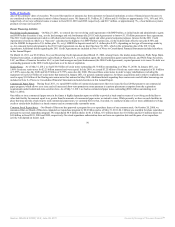
Customer Services provides support services, both on-site and remote, to customers to enable increased performance and higher availability of their products and
services. The cost of providing our Cloud Services offerings consists primarily of personnel related expenditures, technology infrastructure expenditures and
facilities costs.
Year Ended May 31,
2011
Percent Change
2010
Percent Change
2009
(Dollars in millions) Actual Constant Actual Constant
Cloud Services Revenues:
Americas $ 676 52% 50% $ 445 3% 2% $ 432
EMEA 511 73% 72% 295 28% 30% 230
Asia Pacific 191 43% 32% 134 15% 8% 117
Total revenues 1,378 58% 54% 874 12% 11% 779
Expenses:
Services(1) 1,082 56% 52% 696 12% 11% 621
Stock-based compensation 7 24% 24% 5 22% 22% 4
Amortization of intangible assets(2) 27 36% 36% 20 44% 44% 13
Total expenses 1,116 55% 52% 721 13% 11% 638
Total Margin $ 262 71% 66% $ 153 9% 8% $ 141
Total Margin % 19% 18% 18%
% Revenues by Geography:
Americas 49% 51% 55%
EMEA 37% 34% 30%
Asia Pacific 14% 15% 15%
(1) Excluding stock-based compensation
(2) Included as a component of ‘Amortization of Intangible Assets’ in our consolidated statements of operations
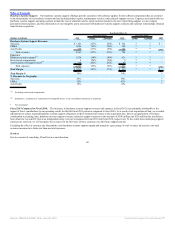
Fiscal 2011 Compared to Fiscal 2010: Excluding the effect of currency rate fluctuations, the increase in our Cloud Services revenues in fiscal 2011 was
primarily due to the full fiscal year impact of revenue contributions from our acquisition of Sun and, to a lesser extent, increased revenues from our legacy
Advanced Customer Services and legacy Oracle Cloud Services offerings. Excluding the effect of currency rate fluctuations, the Americas contributed 49%,
EMEA contributed 42% and Asia Pacific contributed 9% to the increase in our Cloud Services revenues.
On a constant currency basis, Cloud Services expenses increased primarily due to additional employee related expenses associated with a full fiscal year of
expense contributions from Sun and higher third party contractor expenses that supported the increase in our revenues.
On a constant currency basis, both Cloud Services margin and margin as a percentage of revenues increased during fiscal 2011 as our total revenues increased at
a faster rate than our total expenses.
Fiscal 2010 Compared to Fiscal 2009: Excluding the effect of currency rate fluctuations, the increase in our Cloud Services revenues was primarily due to
revenue contributions from Sun and increased revenues from our legacy Advanced Customer Services offerings. These increases were partially offset by
modestly lower revenues in our legacy Oracle Cloud Services business. Excluding the effect of currency rate fluctuations, the Americas contributed 11%, EMEA
contributed 78% and Asia Pacific contributed 11% to the increase in our Cloud Services revenues.
On a constant currency basis, Cloud Services expenses increased primarily due to Sun and were partially offset by lower expenses from our legacy Cloud
Services operations, primarily reduced employee related expenses.
On a constant currency basis, Cloud Services margin increased primarily due to expense reductions in our legacy Cloud Services operations, while margin as a
percentage of revenues was flat.
62
Source: ORACLE CORP, 10-K, June 28, 2011 Powered by Morningstar® Document Research℠