Oracle 2010 Annual Report Download - page 63
Download and view the complete annual report
Please find page 63 of the 2010 Oracle annual report below. You can navigate through the pages in the report by either clicking on the pages listed below, or by using the keyword search tool below to find specific information within the annual report.-
 1
1 -
2
-
3
-
4
-
5
-
6
-
7
-
8
-
9
-
10
-
11
-
12
-
13
-
14
-
15
-
16
-
17
-
18
-
19
-
20
-
21
-
22
-
23
-
24
-
25
-
26
-
27
-
28
-
29
-
30
-
31
-
32
-
33
-
34
-
35
-
36
-
37
-
38
-
39
-
40
-
41
-
42
-
43
-
44
-
45
-
46
-
47
-
48
-
49
-
50
-
51
-
52
-
 53
53 -
 54
54 -
 55
55 -
 56
56 -
 57
57 -
 58
58 -
 59
59 -
 60
60 -
 61
61 -
 62
62 -
 63
63 -
 64
64 -
 65
65 -
 66
66 -
 67
67 -
 68
68 -
 69
69 -
 70
70 -
 71
71 -
 72
72 -
 73
73 -
74
-
75
-
76
-
77
-
78
-
79
-
80
-
81
-
82
-
83
-
84
-
85
-
86
-
87
-
88
-
89
-
90
-
91
-
92
-
93
-
94
-
95
-
96
-
97
-
98
-
99
-
100
-
101
-
102
-
103
-
104
-
105
-
106
-
107
-
108
-
109
-
110
-
111
-
112
-
113
-
114
-
115
-
116
-
117
-
118
-
119
-
120
-
121
-
122
-
123
-
124
-
125
-
126
-
127
-
128
-
129
-
130
-
131
-
132
-
133
-
134
-
135
-
136
-
137
-
138
-
139
-
140
-
141
-
142
-
143
-
144
-
145
-
146
-
147
-
148
-
149
-
150
-
151
-
152
-
153
-
154
-
155
-
156
-
157
-
158
-
159
-
160
-
161
-
162
-
163
-
164
-
165
-
166
-
167
-
168
-
169
-
170
-
171
-
172
-
173
-
174
-
175
-
176
-
177
-
178
-
179
-
180
-
181
-
182
-
183
-
184
-
185
-
186
-
187
-
188
-
189
-
190
-
191
-
192
-
193
-
194
-
195
-
196
-
197
-
198
-
199
-
200
-
201
-
202
-
203
-
204
-
205
-
206
-
207
-
208
-
209
-
210
-
211
-
212
-
213
-
214
-
215
-
216
-
217
-
218
-
219
-
220
-
221
-
222
-
223
-
224
-
225
-
226
-
227
-
228
-
229
-
230
-
231
-
232
-
233
-
234
-
235
-
236
-
237
-
238
-
239
-
240
-
241
-
242
-
243
-
244
-
245
-
246
-
247
-
248
-
249
-
250
-
251
-
252
-
253
-
254
-
255
-
256
-
257
-
258
-
259
-
260
-
261
-
262
-
263
-
264
-
265
-
266
-
267
-
268
-
269
-
270
-
271
-
272
 |
 |

Table of Contents
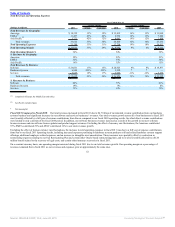
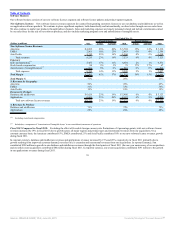
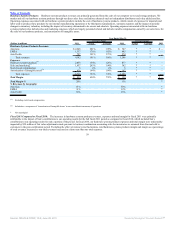
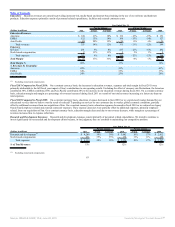
Hardware Systems Products: Hardware systems products revenues are primarily generated from the sales of our computer server and storage products. We
market and sell our hardware systems products through our direct sales force and indirect channels such as independent distributors and value added resellers.
Operating expenses associated with our hardware systems products include the cost of hardware systems products, which consist of expenses for materials and
labor used to produce these products by our internal manufacturing operations or by third party manufacturers, warranty expenses and the impact of periodic
changes in inventory valuation, including the impact of inventory determined to be excess and obsolete. Operating expenses associated with our hardware
systems products also include sales and marketing expenses, which are largely personnel related and include variable compensation earned by our sales force for
the sales of our hardware products, and amortization of intangible assets.
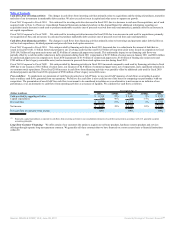
Year Ended May 31,
2011
Percent Change
2010
Percent Change
2009
(Dollars in millions) Actual Constant Actual Constant
Hardware Systems Products Revenues:
Americas $ 2,248 201% 199% $ 747 * * $ —
EMEA 1,337 176% 165% 485 * * —
Asia Pacific 797 191% 173% 274 * * —
Total revenues 4,382 191% 184% 1,506 * * —
Expenses:
Hardware systems products(1) 2,055 134% 126% 877 * * —
Sales and marketing(1) 1,037 203% 194% 342 * * —
Stock-based compensation 5 4% 4% 5 * * —
Amortization of intangible assets(2) 426 164% 164% 162 * * —
Total expenses 3,523 154% 146% 1,386 * * —
Total Margin $ 859 634% 732% $ 120 * * $ —
Total Margin % 20% 8% *
% Revenues by Geography:
Americas 51% 50% *
EMEA 31% 32% *
Asia Pacific 18% 18% *
(1) Excluding stock-based compensation
(2) Included as a component of ‘Amortization of Intangible Assets’ in our consolidated statements of operations
* Not meaningful
Fiscal 2011 Compared to Fiscal 2010: The increases in hardware systems products revenues, expenses and total margin for fiscal 2011 were primarily
attributable to the impact of Sun’s contributions to our operating results for the full fiscal 2011 period as compared to fiscal 2010, which included Sun’s
contribution to our operating results for only a portion of the period. In fiscal 2010, our hardware systems products expenses and total margin were unfavorably
impacted by $29 million of fair value adjustments made pursuant to business combination accounting rules for inventories we assumed from Sun and sold to
customers in the post-combination period. Excluding the effect of currency rate fluctuations, total hardware systems products margin and margin as a percentage
of total revenues increased as our total revenues increased at a faster rate than our total expenses.
59
Source: ORACLE CORP, 10-K, June 28, 2011 Powered by Morningstar® Document Research℠