Oracle 2009 Annual Report Download - page 80
Download and view the complete annual report
Please find page 80 of the 2009 Oracle annual report below. You can navigate through the pages in the report by either clicking on the pages listed below, or by using the keyword search tool below to find specific information within the annual report.-
 1
1 -
2
-
3
-
4
-
5
-
6
-
7
-
8
-
9
-
10
-
11
-
12
-
13
-
14
-
15
-
16
-
17
-
18
-
19
-
20
-
21
-
22
-
23
-
24
-
25
-
26
-
27
-
28
-
29
-
30
-
31
-
32
-
33
-
34
-
35
-
36
-
37
-
38
-
39
-
40
-
41
-
42
-
43
-
44
-
45
-
46
-
47
-
48
-
49
-
50
-
51
-
52
-
53
-
54
-
55
-
56
-
57
-
58
-
59
-
60
-
61
-
62
-
63
-
64
-
65
-
66
-
67
-
68
-
69
-
 70
70 -
 71
71 -
 72
72 -
 73
73 -
 74
74 -
 75
75 -
 76
76 -
 77
77 -
 78
78 -
 79
79 -
 80
80 -
 81
81 -
 82
82 -
 83
83 -
 84
84 -
 85
85 -
 86
86 -
 87
87 -
 88
88 -
 89
89 -
 90
90 -
91
-
92
-
93
-
94
-
95
-
96
-
97
-
98
-
99
-
100
-
101
-
102
-
103
-
104
-
105
-
106
-
107
-
108
-
109
-
110
-
111
-
112
-
113
-
114
-
115
-
116
-
117
-
118
-
119
-
120
-
121
-
122
-
123
-
124
-
125
-
126
-
127
-
128
-
129
-
130
-
131
-
132
-
133
-
134
-
135
-
136
-
137
-
138
-
139
-
140
-
141
-
142
-
143
-
144
-
145
-
146
-
147
-
148
-
149
-
150
-
151
-
152
-
153
-
154
-
155
-
156
-
157
-
158
-
159
-
160
-
161
-
162
-
163
-
164
-
165
-
166
-
167
-
168
-
169
-
170
-
171
-
172
-
173
-
174
-
175
-
176
-
177
-
178
-
179
-
180
-
181
-
182
-
183
-
184
-
185
-
186
-
187
-
188
-
189
-
190
-
191
-
192
-
193
-
194
-
195
-
196
-
197
-
198
-
199
-
200
-
201
-
202
-
203
-
204
-
205
-
206
-
207
-
208
-
209
-
210
-
211
-
212
-
213
-
214
-
215
-
216
-
217
-
218
-
219
-
220
-
221
-
222
-
223
-
224
 |
 |
Table of Contents
realized gain or loss with respect to currency fluctuations will generally depend on the size and type of cross-currency transactions that we enter into, the
currency exchange rates associated with these exposures and changes in those rates, whether we have entered into foreign currency forward contracts to offset
these exposures and other factors.
Historically, we have not used foreign currency forward contracts for trading purposes and have not designated these forward contracts as hedging instruments
pursuant to ASC 815. Accordingly, we have recorded the fair value of these historical contracts as of the end of our reporting period to our consolidated balance
sheet with changes in fair value recorded to non-operating income (expense), net in our consolidated statement of operations. As of May 31, 2010, we estimate
that certain of our U.S. Dollar and Euro functional subsidiaries have the equivalent of approximately $2.0 billion and approximately €410 million (approximately
$500 million) of net intercompany receivables whereby the amounts to be received by these subsidiaries are in currencies other than U.S. Dollars or Euros,
respectively, and are therefore subject to remeasurement as of each balance sheet date. As of May 31, 2010, we have no financial instruments in place to mitigate
the risks associated with these foreign currency exposures. If overall foreign currency exchange rates weaken (strengthen) against both the U.S. Dollar and Euro
by 10%, we estimate that we would incur approximately $250 million of remeasurement losses (gains) in connection with these intercompany balances assuming
the balances remained constant with those as of May 31, 2010. Net foreign exchange transaction (losses) gains included in non-operating income (expense), net
in the accompanying consolidated statements of operations were $(149) million, $(65) million and $17 million in fiscal 2010, 2009 and 2008, respectively.
Included in the net foreign exchange transaction losses for fiscal 2010 were foreign currency losses relating to our Venezuelan subsidiary’s operations, which are
more thoroughly described under “Non-Operating Income (Expense), net” in Management’s Discussion and Analysis of Financial Condition and Results of
Operations above. As a large portion of our consolidated operations are international, we could experience additional foreign currency volatility in the future, the
amounts and timing of which may vary.
Foreign Currency Translation Risk
Fluctuations in foreign currencies impact the amount of total assets and liabilities that we report for our foreign subsidiaries upon the translation of these amounts
into U.S. Dollars. In particular, the amount of cash, cash equivalents and marketable securities that we report in U.S. Dollars for a significant portion of the cash
held by these subsidiaries is subject to translation variance caused by changes in foreign currency exchange rates as of the end of each respective reporting period
(the offset to which is recorded to accumulated other comprehensive income on our consolidated balance sheet). Periodically, we hedge net assets of certain
international subsidiaries from foreign currency exposure and provide a discussion in “Foreign Currency Net Investment Risk” below.
As the U.S. Dollar fluctuated against certain international currencies as of the end of fiscal 2010, the amount of cash, cash equivalents and marketable securities
that we reported in U.S. Dollars for these subsidiaries as of May 31, 2010 declined relative to what we would have reported using a constant currency rate as of
May 31, 2009. As reported in our consolidated statements of cash flows, the estimated effect of exchange rate changes on our reported cash and cash equivalents
balances in U.S. Dollars for fiscal 2010, 2009 and 2008 was a (decrease) increase of $(107) million, $(501) million, and $437 million, respectively. The
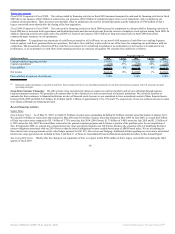
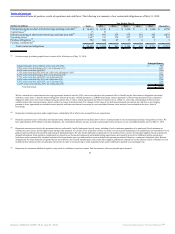
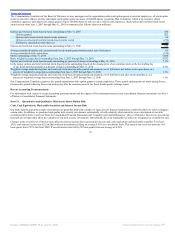
following table includes the U.S. Dollar equivalent of cash, cash equivalents and marketable securities denominated in certain major foreign currencies as of
May 31, 2010:
(in millions)
U.S. Dollar
Equivalent at
May 31, 2010
Euro $ 1,310
Japanese Yen 867
Chinese Renminbi 788
British Pound 566
Indian Rupee 513
Canadian Dollar 496
Other foreign currencies 2,413
Total cash, cash equivalents and marketable securities denominated in foreign currencies $ 6,953
76
Source: ORACLE CORP, 10-K, July 01, 2010 Powered by Morningstar® Document Research℠