Oracle 2009 Annual Report Download - page 68
Download and view the complete annual report
Please find page 68 of the 2009 Oracle annual report below. You can navigate through the pages in the report by either clicking on the pages listed below, or by using the keyword search tool below to find specific information within the annual report.-
 1
1 -
2
-
3
-
4
-
5
-
6
-
7
-
8
-
9
-
10
-
11
-
12
-
13
-
14
-
15
-
16
-
17
-
18
-
19
-
20
-
21
-
22
-
23
-
24
-
25
-
26
-
27
-
28
-
29
-
30
-
31
-
32
-
33
-
34
-
35
-
36
-
37
-
38
-
39
-
40
-
41
-
42
-
43
-
44
-
45
-
46
-
47
-
48
-
49
-
50
-
51
-
52
-
53
-
54
-
55
-
56
-
57
-
 58
58 -
 59
59 -
 60
60 -
 61
61 -
 62
62 -
 63
63 -
 64
64 -
 65
65 -
 66
66 -
 67
67 -
 68
68 -
 69
69 -
 70
70 -
 71
71 -
 72
72 -
 73
73 -
 74
74 -
 75
75 -
 76
76 -
 77
77 -
 78
78 -
79
-
80
-
81
-
82
-
83
-
84
-
85
-
86
-
87
-
88
-
89
-
90
-
91
-
92
-
93
-
94
-
95
-
96
-
97
-
98
-
99
-
100
-
101
-
102
-
103
-
104
-
105
-
106
-
107
-
108
-
109
-
110
-
111
-
112
-
113
-
114
-
115
-
116
-
117
-
118
-
119
-
120
-
121
-
122
-
123
-
124
-
125
-
126
-
127
-
128
-
129
-
130
-
131
-
132
-
133
-
134
-
135
-
136
-
137
-
138
-
139
-
140
-
141
-
142
-
143
-
144
-
145
-
146
-
147
-
148
-
149
-
150
-
151
-
152
-
153
-
154
-
155
-
156
-
157
-
158
-
159
-
160
-
161
-
162
-
163
-
164
-
165
-
166
-
167
-
168
-
169
-
170
-
171
-
172
-
173
-
174
-
175
-
176
-
177
-
178
-
179
-
180
-
181
-
182
-
183
-
184
-
185
-
186
-
187
-
188
-
189
-
190
-
191
-
192
-
193
-
194
-
195
-
196
-
197
-
198
-
199
-
200
-
201
-
202
-
203
-
204
-
205
-
206
-
207
-
208
-
209
-
210
-
211
-
212
-
213
-
214
-
215
-
216
-
217
-
218
-
219
-
220
-
221
-
222
-
223
-
224
 |
 |
Table of Contents
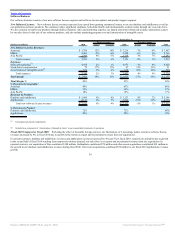
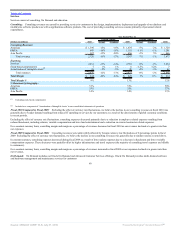
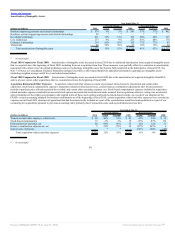
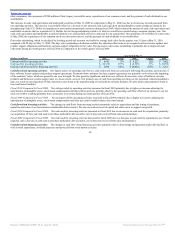
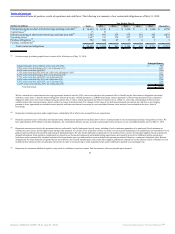
Amortization of Intangible Assets:
Year Ended May 31,
2010
Percent Change
2009
Percent Change
2008
(Dollars in millions) Actual Constant Actual Constant
Software support agreements and related relationships $ 574 5% 5% $ 549 37% 37% $ 402
Hardware systems support agreements and related relationships 29 * * — * * —
Developed technology 811 12% 12% 722 40% 40% 515
Core technology 277 9% 9% 255 43% 44% 178
Customer relationships 234 56% 56% 150 77% 77% 85
Trademarks 48 30% 30% 37 16% 16% 32
Total amortization of intangible assets $ 1,973 15% 15% $ 1,713 41% 42% $ 1,212
* Not meaningful
Fiscal 2010 Compared to Fiscal 2009: Amortization of intangible assets increased in fiscal 2010 due to additional amortization from acquired intangible assets
that we acquired since the beginning of fiscal 2009, including from our acquisition from Sun. These increases were partially offset by a reduction in amortization
associated with certain of our developed technology and core technology intangible assets that became fully amortized in the third quarter of fiscal 2010. See
Note 7 of Notes to Consolidated Financial Statements included elsewhere in this Annual Report for additional information regarding our intangible assets
(including weighted average useful lives) and related amortization.
Fiscal 2009 Compared to Fiscal 2008: Amortization of intangible assets increased in fiscal 2009 due to the amortization of acquired intangibles from BEA
and, to a lesser extent, other acquisitions that we consummated since the beginning of fiscal 2008.
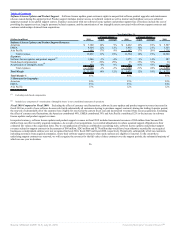
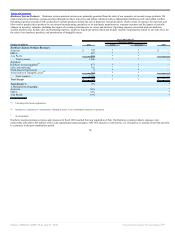
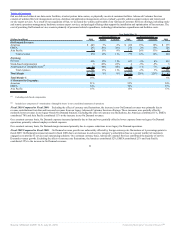
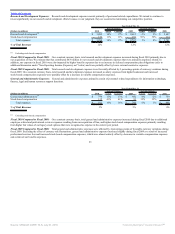
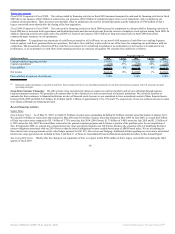
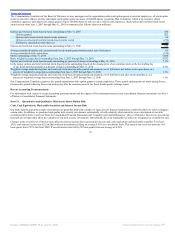
Acquisition Related and Other Expenses: Acquisition related and other expenses consist of personnel related costs for transitional and certain other
employees, stock-based compensation expenses, integration related professional services, certain business combination adjustments after the measurement
periods or purchase price allocation periods have ended, and certain other operating expenses, net. Stock-based compensation expenses included in acquisition
related and other expenses resulted from unvested stock options and restricted stock-based awards assumed from acquisitions whereby vesting was accelerated
upon termination of the employees pursuant to the original terms of those stock options and restricted stock-based awards. As a result of our adoption of the
FASB’s revised accounting standard for business combinations as of the beginning of fiscal 2010, certain acquisition related and other expenses were recorded as
expenses in our fiscal 2010 statement of operations that had been historically included as a part of the consideration transferred and capitalized as a part of our
accounting for acquisitions pursuant to previous accounting rules, primarily direct transaction costs such as professional services fees.
Year Ended May 31,
2010
Percent Change
2009
Percent Change
2008
(Dollars in millions) Actual Constant Actual Constant
Transitional and other employee related costs $ 66 46% 54% $ 45 41% 34% $ 32
Stock-based compensation 15 -1% -1% 15 -87% -87% 112
Professional fees and other, net 68 99% 96% 35 12% 12% 31
Business combination adjustments, net 5 -79% -76% 22 267% 267% 6
Gain on sale of property — * * — -100% -100% (57)
Total acquisition related and other expenses $ 154 32% 36% $ 117 -6% -4% $ 124
* Not meaningful
64
Source: ORACLE CORP, 10-K, July 01, 2010 Powered by Morningstar® Document Research℠