Oracle 2009 Annual Report Download - page 54
Download and view the complete annual report
Please find page 54 of the 2009 Oracle annual report below. You can navigate through the pages in the report by either clicking on the pages listed below, or by using the keyword search tool below to find specific information within the annual report.-
 1
1 -
2
-
3
-
4
-
5
-
6
-
7
-
8
-
9
-
10
-
11
-
12
-
13
-
14
-
15
-
16
-
17
-
18
-
19
-
20
-
21
-
22
-
23
-
24
-
25
-
26
-
27
-
28
-
29
-
30
-
31
-
32
-
33
-
34
-
35
-
36
-
37
-
38
-
39
-
40
-
41
-
42
-
43
-
 44
44 -
 45
45 -
 46
46 -
 47
47 -
 48
48 -
 49
49 -
 50
50 -
 51
51 -
 52
52 -
 53
53 -
 54
54 -
 55
55 -
 56
56 -
 57
57 -
 58
58 -
 59
59 -
 60
60 -
 61
61 -
 62
62 -
 63
63 -
 64
64 -
65
-
66
-
67
-
68
-
69
-
70
-
71
-
72
-
73
-
74
-
75
-
76
-
77
-
78
-
79
-
80
-
81
-
82
-
83
-
84
-
85
-
86
-
87
-
88
-
89
-
90
-
91
-
92
-
93
-
94
-
95
-
96
-
97
-
98
-
99
-
100
-
101
-
102
-
103
-
104
-
105
-
106
-
107
-
108
-
109
-
110
-
111
-
112
-
113
-
114
-
115
-
116
-
117
-
118
-
119
-
120
-
121
-
122
-
123
-
124
-
125
-
126
-
127
-
128
-
129
-
130
-
131
-
132
-
133
-
134
-
135
-
136
-
137
-
138
-
139
-
140
-
141
-
142
-
143
-
144
-
145
-
146
-
147
-
148
-
149
-
150
-
151
-
152
-
153
-
154
-
155
-
156
-
157
-
158
-
159
-
160
-
161
-
162
-
163
-
164
-
165
-
166
-
167
-
168
-
169
-
170
-
171
-
172
-
173
-
174
-
175
-
176
-
177
-
178
-
179
-
180
-
181
-
182
-
183
-
184
-
185
-
186
-
187
-
188
-
189
-
190
-
191
-
192
-
193
-
194
-
195
-
196
-
197
-
198
-
199
-
200
-
201
-
202
-
203
-
204
-
205
-
206
-
207
-
208
-
209
-
210
-
211
-
212
-
213
-
214
-
215
-
216
-
217
-
218
-
219
-
220
-
221
-
222
-
223
-
224
 |
 |

Table of Contents
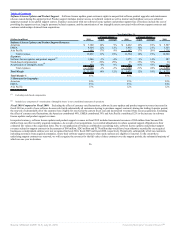
On a constant currency basis, our operating margin increased during fiscal 2010 due to higher revenues from our software business, partially offset by an
estimated $620 million reduction to our operating income from Sun. Our operating margin as a percentage of revenues declined in fiscal 2010 due to the
post-combination expense contributions from our new hardware systems business and due to our acquisition related expenses, restructuring expenses and
amortization of intangible assets, which increased at a faster rate than our total revenues, primarily due to Sun.
Fiscal 2009 Compared to Fiscal 2008: Our operating results for fiscal 2009 were unfavorably impacted by the strengthening of the U.S. Dollar relative to
other major international currencies. These currency variances resulted in a reduction to our total revenues growth of 6 percentage points during fiscal 2009. On a
constant currency basis, total revenues increased in fiscal 2009 primarily due to higher software license update and product support revenues in all regions and
incremental revenues from our recent acquisitions, primarily our acquisition of BEA. On a constant currency basis, new software license revenues contributed
5% to the growth in total revenues, software license updates and product support revenues contributed 92% and services revenues contributed 3%. Excluding the
effect of currency rate fluctuations, the Americas contributed 39% to the increase in total revenues, EMEA contributed 42% and Asia Pacific contributed 19%.
Favorable currency variances resulted in a reduction to our total operating expense growth of 5 percentage points during fiscal 2009. Excluding the effect of
currency rate fluctuations, the increase in operating expenses in fiscal 2009 is primarily due to higher salary expenses associated with increased headcount levels
from acquisitions (primarily BEA) and higher amortization of intangible assets resulting from our acquisitions (primarily BEA). In addition, acquisition related
and other expenses increased during fiscal 2009 due to a $57 million gain on property sale recognized in fiscal 2008, which decreased our net operating expenses
in that period. These increases were partially offset by constant currency decreases in our variable compensation expenses.
Currency variances resulted in a reduction of 9 percentage points to our total operating margin growth during fiscal 2009. On a constant currency basis, total
operating margin and total operating margin as a percentage of total revenues increased during fiscal 2009 as the growth rate of our total revenues exceeded the
growth rate of our total operating expenses. The growth rate in our total operating expenses was significantly impacted by the growth rate in our intangible asset
amortization, which was primarily due to intangible assets acquired as a part of the BEA transaction, and to a lesser extent, our restructuring expenses growth.
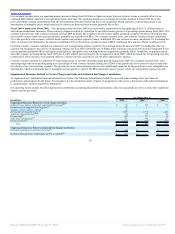
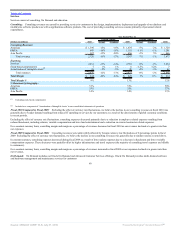
Supplemental Disclosure Related to Certain Charges and Gains and Estimated Sun Margin Contribution
To supplement our consolidated financial information we believe the following information is helpful to an overall understanding of our past financial
performance and prospects for the future. You should review the introduction under “Impact of Acquisitions” (above) for a discussion of the inherent limitations
in comparing pre- and post-acquisition information.
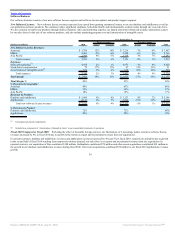
Our operating results include the following business combination accounting adjustments and expenses related to acquisitions as well as certain other significant
expense and income items:
Year Ended May 31,
(in millions) 2010 2009 2008
Supplemental Disclosure Related to Certain Charges and Gains:
Software license updates and product support deferred revenues(1) $ 86 $ 243 $ 179
Hardware systems support deferred revenues(1) 128 — —
Hardware systems products expenses(2) 29 — —
Amortization of intangible assets (3) 1,973 1,713 1,212
Acquisition related and other(4)(6) 154 117 124
Restructuring(5) 622 117 41
Stock-based compensation(6) 421 340 257
Income tax effects(7) (1,054) (730) (535)
Total $ 2,359 $ 1,800 $ 1,278
Supplemental Disclosure Related to Estimated Sun Margin Contribution:
Estimated operating loss contribution from Sun(8) $ (620) $ — $ —
Estimated operating income contribution from Sun, as adjusted(8) $ 371 $ — $ —
50
Source: ORACLE CORP, 10-K, July 01, 2010 Powered by Morningstar® Document Research℠