Oracle 2009 Annual Report Download - page 216
Download and view the complete annual report
Please find page 216 of the 2009 Oracle annual report below. You can navigate through the pages in the report by either clicking on the pages listed below, or by using the keyword search tool below to find specific information within the annual report.-
 1
1 -
2
-
3
-
4
-
5
-
6
-
7
-
8
-
9
-
10
-
11
-
12
-
13
-
14
-
15
-
16
-
17
-
18
-
19
-
20
-
21
-
22
-
23
-
24
-
25
-
26
-
27
-
28
-
29
-
30
-
31
-
32
-
33
-
34
-
35
-
36
-
37
-
38
-
39
-
40
-
41
-
42
-
43
-
44
-
45
-
46
-
47
-
48
-
49
-
50
-
51
-
52
-
53
-
54
-
55
-
56
-
57
-
58
-
59
-
60
-
61
-
62
-
63
-
64
-
65
-
66
-
67
-
68
-
69
-
70
-
71
-
72
-
73
-
74
-
75
-
76
-
77
-
78
-
79
-
80
-
81
-
82
-
83
-
84
-
85
-
86
-
87
-
88
-
89
-
90
-
91
-
92
-
93
-
94
-
95
-
96
-
97
-
98
-
99
-
100
-
101
-
102
-
103
-
104
-
105
-
106
-
107
-
108
-
109
-
110
-
111
-
112
-
113
-
114
-
115
-
116
-
117
-
118
-
119
-
120
-
121
-
122
-
123
-
124
-
125
-
126
-
127
-
128
-
129
-
130
-
131
-
132
-
133
-
134
-
135
-
136
-
137
-
138
-
139
-
140
-
141
-
142
-
143
-
144
-
145
-
146
-
147
-
148
-
149
-
150
-
151
-
152
-
153
-
154
-
155
-
156
-
157
-
158
-
159
-
160
-
161
-
162
-
163
-
164
-
165
-
166
-
167
-
168
-
169
-
170
-
171
-
172
-
173
-
174
-
175
-
176
-
177
-
178
-
179
-
180
-
181
-
182
-
183
-
184
-
185
-
186
-
187
-
188
-
189
-
190
-
191
-
192
-
193
-
194
-
195
-
196
-
197
-
198
-
199
-
200
-
201
-
202
-
203
-
204
-
205
-
 206
206 -
 207
207 -
 208
208 -
 209
209 -
 210
210 -
 211
211 -
 212
212 -
 213
213 -
 214
214 -
 215
215 -
 216
216 -
 217
217 -
 218
218 -
 219
219 -
 220
220 -
 221
221 -
 222
222 -
 223
223 -
 224
224
 |
 |

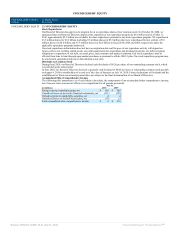
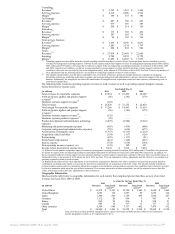
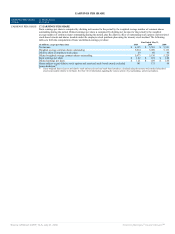
Consulting:
Revenues(1) $ 2,705 $ 3,221 $ 3,454
Services expenses 2,319 2,686 2,914
Margin(2) $ 386 $ 535 $ 540
On Demand:
Revenues(1) $ 887 $ 780 $ 695
Services expenses 679 566 569
Margin(2) $ 208 $ 214 $ 126
Education:
Revenues(1) $ 337 $ 385 $ 452
Services expenses 247 282 314
Margin(2) $ 90 $ 103 $ 138
Total services business:
Revenues(1) $ 3,929 $ 4,386 $ 4,601
Services expenses 3,245 3,534 3,797
Margin(2) $ 684 $ 852 $ 804
Totals:
Revenues(1) $ 27,034 $ 23,495 $ 22,609
Expenses 9,748 8,552 8,770
Margin(2) $ 17,286 $ 14,943 $ 13,839
(1) Operating segment revenues differ from the external reporting classifications due to certain software license products that are classified as service
revenues for management reporting purposes. Software license updates and product support revenues for management reporting included $86 million,
$243 million and $179 million of revenues that we did not recognize in the accompanying consolidated statements of operations in fiscal 2010, 2009
and 2008, respectively. In addition, we did not recognize hardware systems support revenues related to hardware systems support contracts that
would have otherwise been recorded by Sun as an independent entity, in the amount of $128 million in fiscal 2010. See Note 10 for an explanation of
these adjustments and the following table for a reconciliation of operating segment revenues to total revenues.
(2) The margins reported reflect only the direct controllable costs of each line of business and do not include allocations of product development,
information technology, marketing and partner programs, and corporate and general and administrative expenses incurred in support of the lines of
business. Additionally, the margins do not reflect the amortization of intangible assets, acquisition related and other expenses, restructuring costs, or
stock-based compensation.
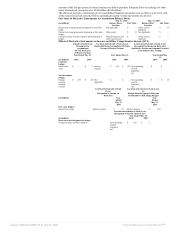
The following table reconciles operating segment revenues to total revenues as well as operating segment margin to income
before provision for income taxes:
Year Ended May 31,
(in millions) 2010 2009 2008
Total revenues for reportable segments $ 27,034 $ 23,495 $ 22,609
Software license updates and product support
revenues(1) (86) (243) (179)
Hardware systems support revenues(1) (128) — —
Total revenues $ 26,820 $ 23,252 $ 22,430
Total margin for reportable segments $ 17,286 $ 14,943 $ 13,839
Software license updates and product support
revenues(1) (86) (243) (179)
Hardware systems support revenues(1) (128) — —
Hardware systems products expenses(2) (29) — —
Product development and information technology
expenses
(3,479) (2,984) (3,012)
Marketing and partner program expenses (503) (439) (460)
Corporate and general and administrative expenses (755) (634) (677)
Amortization of intangible assets (1,973) (1,713) (1,212)
Acquisition related and other (154) (117) (124)
Restructuring (622) (117) (41)
Stock-based compensation (421) (340) (257)
Interest expense (754) (630) (394)
Non-operating income (expense), net (139) 108 351
Income before provision for income taxes $ 8,243 $ 7,834 $ 7,834
(1) Software license updates and product support revenues for management reporting include $86 million, $243 million and $179 million of revenues that
we did not recognize in the accompanying condensed consolidated statements of operations for fiscal 2010, 2009 and 2008, respectively. In addition, we
did not recognize hardware systems support revenues related to hardware systems support contracts that would have otherwise been recorded by Sun as an
independent entity, in the amount of $128 million for fiscal 2010. See Note 10 for an explanation of these adjustments and this table for a reconciliation of
operating segment revenues to total revenues
(2) Represents the effects of fair value adjustments to our inventories acquired from Sun that were sold to customers in the periods presented. Business
combination accounting rules require us to account for inventories assumed from our acquisitions at their fair values. The amount included in hardware
systems products expenses above is intended to adjust these expenses to the hardware systems products expenses that would have been otherwise recorded
by Sun as a standalone entity upon the sale of these inventories. If we assume inventories in future acquisitions, we will be required to assess their fair
values, which may result in fair value adjustments to those inventories
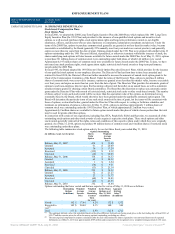
Geographic Information
Disclosed in the table below is geographic information for each country that comprised greater than three percent of our total
revenues for fiscal 2010, 2009 or 2008.
As of and for the Year Ended May 31,
2010 2009 2008
(in millions) Revenues Long Lived
Assets(1) Revenues Long Lived
Assets(1) Revenues Long Lived
Assets(1)
United States $ 11,472 $ 2,141 $ 10,190 $ 1,466 $ 9,650 $ 1,465
United Kingdom 1,685 136 1,587 89 1,655 110
Japan 1,349 505 1,189 485 1,068 207
Germany 1,112 20 956 5 983 9
France 965 24 856 8 858 21
Canada 888 10 737 13 737 15
Other countries 9,349 660 7,737 462 7,479 532
Total $ 26,820 $ 3,496 $ 23,252 $ 2,528 $ 22,430 $ 2,359
(1) Long-lived assets exclude goodwill, intangible assets, equity investments and deferred taxes, which are not allocated to
specific geographic locations as it is impracticable to do so.
Source: ORACLE CORP, 10-K, July 01, 2010 Powered by Morningstar® Document Research℠