Oracle 2009 Annual Report Download - page 76
Download and view the complete annual report
Please find page 76 of the 2009 Oracle annual report below. You can navigate through the pages in the report by either clicking on the pages listed below, or by using the keyword search tool below to find specific information within the annual report.-
 1
1 -
2
-
3
-
4
-
5
-
6
-
7
-
8
-
9
-
10
-
11
-
12
-
13
-
14
-
15
-
16
-
17
-
18
-
19
-
20
-
21
-
22
-
23
-
24
-
25
-
26
-
27
-
28
-
29
-
30
-
31
-
32
-
33
-
34
-
35
-
36
-
37
-
38
-
39
-
40
-
41
-
42
-
43
-
44
-
45
-
46
-
47
-
48
-
49
-
50
-
51
-
52
-
53
-
54
-
55
-
56
-
57
-
58
-
59
-
60
-
61
-
62
-
63
-
64
-
65
-
 66
66 -
 67
67 -
 68
68 -
 69
69 -
 70
70 -
 71
71 -
 72
72 -
 73
73 -
 74
74 -
 75
75 -
 76
76 -
 77
77 -
 78
78 -
 79
79 -
 80
80 -
 81
81 -
 82
82 -
 83
83 -
 84
84 -
 85
85 -
 86
86 -
87
-
88
-
89
-
90
-
91
-
92
-
93
-
94
-
95
-
96
-
97
-
98
-
99
-
100
-
101
-
102
-
103
-
104
-
105
-
106
-
107
-
108
-
109
-
110
-
111
-
112
-
113
-
114
-
115
-
116
-
117
-
118
-
119
-
120
-
121
-
122
-
123
-
124
-
125
-
126
-
127
-
128
-
129
-
130
-
131
-
132
-
133
-
134
-
135
-
136
-
137
-
138
-
139
-
140
-
141
-
142
-
143
-
144
-
145
-
146
-
147
-
148
-
149
-
150
-
151
-
152
-
153
-
154
-
155
-
156
-
157
-
158
-
159
-
160
-
161
-
162
-
163
-
164
-
165
-
166
-
167
-
168
-
169
-
170
-
171
-
172
-
173
-
174
-
175
-
176
-
177
-
178
-
179
-
180
-
181
-
182
-
183
-
184
-
185
-
186
-
187
-
188
-
189
-
190
-
191
-
192
-
193
-
194
-
195
-
196
-
197
-
198
-
199
-
200
-
201
-
202
-
203
-
204
-
205
-
206
-
207
-
208
-
209
-
210
-
211
-
212
-
213
-
214
-
215
-
216
-
217
-
218
-
219
-
220
-
221
-
222
-
223
-
224
 |
 |

Table of Contents
As of May 31, 2010, we have $2.5 billion of unrecognized tax benefits recorded on our consolidated balance sheet. We have reached certain settlement
agreements with relevant taxing authorities to pay approximately $79 million of these liabilities (these amounts have been excluded from the table above due to
the uncertainty of when they might be settled). Although it remains unclear as to when payments pursuant to these agreements will be made, some or all may be
made in fiscal 2011. We cannot make a reasonably reliable estimate of the period in which the remainder of our unrecognized tax benefits will be settled or
released with the relevant tax authorities, although we believe it is reasonably possible that certain of these liabilities could be settled or released during fiscal
2011.
Separately, in the fourth quarter of fiscal 2010, we agreed to acquire Phase Forward Incorporated, a provider of applications for life sciences companies and
healthcare providers, for $17.00 per share in cash, amounting to approximately $810 million. Our proposed acquisition of Phase Forward is subject to
stockholder and regulatory approval and other customary closing conditions. In addition, we agreed to acquire certain other companies for amounts that are not
material to our business. We intend to finance our proposed acquisitions through a combination of our internally available cash, our cash generated from
operations, our existing available debt capacity, additional borrowings, or from the issuance of additional securities.
We believe that our current cash, cash equivalents and marketable securities and cash generated from operations will be sufficient to meet our working capital,
capital expenditures and contractual obligations. In addition, we believe we could fund any future acquisitions, dividend payments and repurchases of common
stock or debt with our internally available cash, cash equivalents and marketable securities, cash generated from operations, our existing available debt capacity,
additional borrowings or from the issuance of additional securities.
Off-Balance Sheet Arrangements: We do not have any off-balance sheet arrangements that have or are reasonably likely to have a current or future effect on
our financial condition, changes in financial condition, revenues or expenses, results of operations, liquidity, capital expenditures or capital resources that are
material to investors.
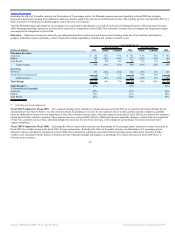
Selected Quarterly Financial Data
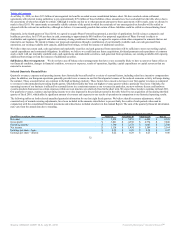
Quarterly revenues, expenses and operating income have historically been affected by a variety of seasonal factors, including sales force incentive compensation
plans. In addition, our European operations generally provide lower revenues in our first fiscal quarter because of the reduced economic activity in Europe during
the summer. These seasonal factors are common in the high technology industry. These factors have caused a decrease in our first quarter revenues as compared
to revenues in the immediately preceding fourth quarter, which historically has been our highest revenue quarter within a particular fiscal year. Similarly, the
operating income of our business is affected by seasonal factors in a consistent manner as our revenues (in particular, our new software license and hardware
systems products businesses) as certain expenses within our cost structure are relatively fixed in the short term. We expect these trends to continue in fiscal 2011.
Our quarterly revenues, expenses and operating income were also impacted in the periods presented in the table below by our acquisition of Sun during the third
quarter of fiscal 2010, which added a significant amount of revenues and expenses to our results of operations in comparison to our historical operating results.
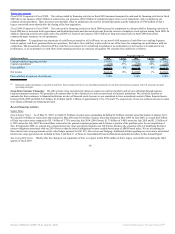
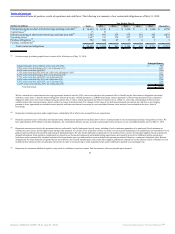
The following tables set forth selected unaudited quarterly information for our last eight fiscal quarters. We believe that all necessary adjustments, which
consisted only of normal recurring adjustments, have been included in the amounts stated below to present fairly the results of such periods when read in
conjunction with the consolidated financial statements and related notes included elsewhere in this Annual Report. The sum of the quarterly financial information
may vary from the annual data due to rounding.
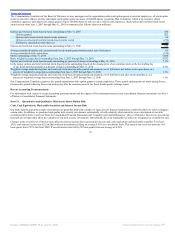
Fiscal 2010 Quarter Ended (Unaudited)
(in millions, except per share amounts) August 31 November 30 February 28 May 31
Revenues $ 5,054 $ 5,858 $ 6,404 $ 9,505
Gross profit $ 3,821 $ 4,530 $ 4,774 $ 7,046
Operating income $ 1,740 $ 2,178 $ 1,843 $ 3,300
Net income $ 1,124 $ 1,458 $ 1,189 $ 2,364
Earnings per share—basic $ 0.22 $ 0.29 $ 0.24 $ 0.47
Earnings per share—diluted $ 0.22 $ 0.29 $ 0.23 $ 0.46
72
Source: ORACLE CORP, 10-K, July 01, 2010 Powered by Morningstar® Document Research℠