Oracle 2009 Annual Report Download - page 53
Download and view the complete annual report
Please find page 53 of the 2009 Oracle annual report below. You can navigate through the pages in the report by either clicking on the pages listed below, or by using the keyword search tool below to find specific information within the annual report.-
 1
1 -
2
-
3
-
4
-
5
-
6
-
7
-
8
-
9
-
10
-
11
-
12
-
13
-
14
-
15
-
16
-
17
-
18
-
19
-
20
-
21
-
22
-
23
-
24
-
25
-
26
-
27
-
28
-
29
-
30
-
31
-
32
-
33
-
34
-
35
-
36
-
37
-
38
-
39
-
40
-
41
-
42
-
 43
43 -
 44
44 -
 45
45 -
 46
46 -
 47
47 -
 48
48 -
 49
49 -
 50
50 -
 51
51 -
 52
52 -
 53
53 -
 54
54 -
 55
55 -
 56
56 -
 57
57 -
 58
58 -
 59
59 -
 60
60 -
 61
61 -
 62
62 -
 63
63 -
64
-
65
-
66
-
67
-
68
-
69
-
70
-
71
-
72
-
73
-
74
-
75
-
76
-
77
-
78
-
79
-
80
-
81
-
82
-
83
-
84
-
85
-
86
-
87
-
88
-
89
-
90
-
91
-
92
-
93
-
94
-
95
-
96
-
97
-
98
-
99
-
100
-
101
-
102
-
103
-
104
-
105
-
106
-
107
-
108
-
109
-
110
-
111
-
112
-
113
-
114
-
115
-
116
-
117
-
118
-
119
-
120
-
121
-
122
-
123
-
124
-
125
-
126
-
127
-
128
-
129
-
130
-
131
-
132
-
133
-
134
-
135
-
136
-
137
-
138
-
139
-
140
-
141
-
142
-
143
-
144
-
145
-
146
-
147
-
148
-
149
-
150
-
151
-
152
-
153
-
154
-
155
-
156
-
157
-
158
-
159
-
160
-
161
-
162
-
163
-
164
-
165
-
166
-
167
-
168
-
169
-
170
-
171
-
172
-
173
-
174
-
175
-
176
-
177
-
178
-
179
-
180
-
181
-
182
-
183
-
184
-
185
-
186
-
187
-
188
-
189
-
190
-
191
-
192
-
193
-
194
-
195
-
196
-
197
-
198
-
199
-
200
-
201
-
202
-
203
-
204
-
205
-
206
-
207
-
208
-
209
-
210
-
211
-
212
-
213
-
214
-
215
-
216
-
217
-
218
-
219
-
220
-
221
-
222
-
223
-
224
 |
 |

Table of Contents
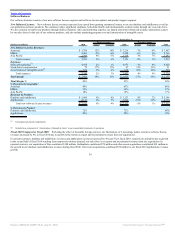
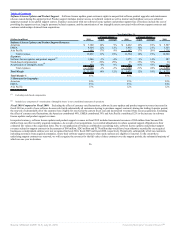
Total Revenues and Operating Expenses
Year Ended May 31,
Percent Change Percent Change
(Dollars in millions) 2010 Actual Constant 2009 Actual Constant 2008
Total Revenues by Geography:
Americas $ 13,819 16% 15% $ 11,900 5% 8% $ 11,330
EMEA(1) 8,938 12% 13% 7,948 0% 11% 7,945
Asia Pacific(2) 4,063 19% 12% 3,404 8% 13% 3,155
Total revenues 26,820 15% 14% 23,252 4% 10% 22,430
Total Operating Expenses 17,758 19% 18% 14,931 2% 7% 14,586
Total Operating Margin $ 9,062 9% 6% $ 8,321 6% 15% $ 7,844
Total Operating Margin % 34% 36% 35%
% Revenues by Geography:
Americas 52% 51% 51%
EMEA 33% 34% 35%
Asia Pacific 15% 15% 14%
Total Revenues by Business:
Software $ 20,625 9% 8% $ 18,877 6% 12% $ 17,843
Hardware Systems 2,290 * * — * * —
Services 3,905 -11% -12% 4,375 -5% 1% 4,587
Total revenues $ 26,820 15% 14% $ 23,252 4% 10% $ 22,430
% Revenues by Business:
Software 77% 81% 80%
Hardware Systems 9% 0% 0%
Services 14% 19% 20%
(1) Comprised of Europe, the Middle East and Africa
(2) Asia Pacific includes Japan
* Not meaningful
Fiscal 2010 Compared to Fiscal 2009: Our total revenues and operating margin for fiscal 2010 were favorably impacted by the movement of the U.S. Dollar
relative to other major currencies. Total revenues increased in fiscal 2010 due to an estimated $2.8 billion revenue contribution from Sun, primarily in our
hardware systems business, and an increase in our total software revenues resulting from growth in our new software licenses revenues and our software license
updates and product support revenues. These increases were partially offset by a constant currency decrease in our total services revenues that we believe was
caused by weaker demand for IT services due to the deterioration in global economic conditions in recent periods. Excluding the effect of currency rate
fluctuations, the Americas contributed 55%, EMEA contributed 32% and APAC contributed 13% to our total revenues growth.
Excluding the unfavorable effect of currency rate fluctuations, the increase in total operating expenses in fiscal 2010 was due to additional operating expenses
incurred as a result of our acquisition of Sun, including increased expenses pertaining to hardware systems products sold and related hardware systems support
offerings, additional employee related expenses including additional stock-based compensation, and an increase in intangible asset amortization. In addition, we
also incurred increased restructuring expenses resulting from our Sun Restructuring Plan and legacy Oracle-based restructuring plans. These increases were
partially offset by expense reductions in our legacy Oracle-based operations including expense reductions in our services business, reductions in bad debt
expenses due to improved collections and reductions to travel expenses due to cost management initiatives.
49
Source: ORACLE CORP, 10-K, July 01, 2010 Powered by Morningstar® Document Research℠