Oracle 2009 Annual Report Download - page 71
Download and view the complete annual report
Please find page 71 of the 2009 Oracle annual report below. You can navigate through the pages in the report by either clicking on the pages listed below, or by using the keyword search tool below to find specific information within the annual report.-
 1
1 -
2
-
3
-
4
-
5
-
6
-
7
-
8
-
9
-
10
-
11
-
12
-
13
-
14
-
15
-
16
-
17
-
18
-
19
-
20
-
21
-
22
-
23
-
24
-
25
-
26
-
27
-
28
-
29
-
30
-
31
-
32
-
33
-
34
-
35
-
36
-
37
-
38
-
39
-
40
-
41
-
42
-
43
-
44
-
45
-
46
-
47
-
48
-
49
-
50
-
51
-
52
-
53
-
54
-
55
-
56
-
57
-
58
-
59
-
60
-
 61
61 -
 62
62 -
 63
63 -
 64
64 -
 65
65 -
 66
66 -
 67
67 -
 68
68 -
 69
69 -
 70
70 -
 71
71 -
 72
72 -
 73
73 -
 74
74 -
 75
75 -
 76
76 -
 77
77 -
 78
78 -
 79
79 -
 80
80 -
 81
81 -
82
-
83
-
84
-
85
-
86
-
87
-
88
-
89
-
90
-
91
-
92
-
93
-
94
-
95
-
96
-
97
-
98
-
99
-
100
-
101
-
102
-
103
-
104
-
105
-
106
-
107
-
108
-
109
-
110
-
111
-
112
-
113
-
114
-
115
-
116
-
117
-
118
-
119
-
120
-
121
-
122
-
123
-
124
-
125
-
126
-
127
-
128
-
129
-
130
-
131
-
132
-
133
-
134
-
135
-
136
-
137
-
138
-
139
-
140
-
141
-
142
-
143
-
144
-
145
-
146
-
147
-
148
-
149
-
150
-
151
-
152
-
153
-
154
-
155
-
156
-
157
-
158
-
159
-
160
-
161
-
162
-
163
-
164
-
165
-
166
-
167
-
168
-
169
-
170
-
171
-
172
-
173
-
174
-
175
-
176
-
177
-
178
-
179
-
180
-
181
-
182
-
183
-
184
-
185
-
186
-
187
-
188
-
189
-
190
-
191
-
192
-
193
-
194
-
195
-
196
-
197
-
198
-
199
-
200
-
201
-
202
-
203
-
204
-
205
-
206
-
207
-
208
-
209
-
210
-
211
-
212
-
213
-
214
-
215
-
216
-
217
-
218
-
219
-
220
-
221
-
222
-
223
-
224
 |
 |

Table of Contents
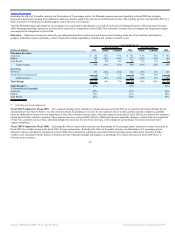
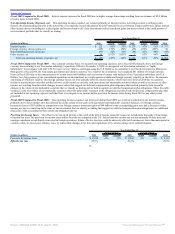
Fiscal 2010 Compared to Fiscal 2009: Provision for income taxes decreased during fiscal 2010 primarily due to recent judicial decisions, including the March
2010 U.S. Court of Appeals Ninth Circuit ruling in Xilinx v. Commissioner, and settlements with various worldwide tax authorities, offset by higher income
before provision for income taxes, which yielded a higher provision for income taxes which was primarily the result of a lower proportion of our worldwide
taxable income being earned in lower tax rate jurisdictions.
Fiscal 2009 Compared to Fiscal 2008: Provision for income taxes decreased during fiscal 2009 in comparison to fiscal 2008 due to a lower effective tax rate,
which was primarily the result of a higher proportion of our worldwide taxable income being earned in lower tax rate jurisdictions.
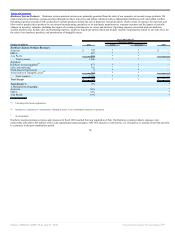
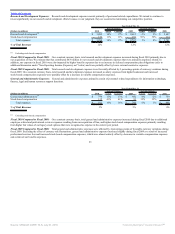
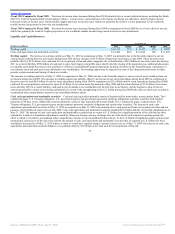
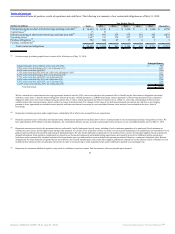
Liquidity and Capital Resources
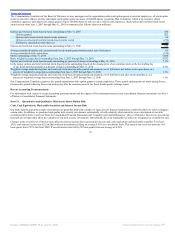
As of May 31,
(Dollars in millions) 2010 Change 2009 Change 2008
Working capital $ 12,313 31% $ 9,432 17% $ 8,074
Cash, cash equivalents and marketable securities $ 18,469 46% $ 12,624 14% $ 11,043
Working capital: The increase in working capital as of May 31, 2010 in comparison to May 31, 2009 was primarily due to the favorable impact to our net
current assets resulting from our net income during fiscal 2010 and our issuance of $4.5 billion of long-term senior notes in July 2009. These increases were
partially offset by $5.6 billion of net cash used for our acquisition of Sun and other companies, the reclassification of $2.2 billion of our senior notes due January
2011 as a current liability, $700 million of cash used to repay Sun’s legacy convertible notes shortly after the closing of the acquisition (see additional discussion
in Liquidity and Capital Resources below and Note 8 of Notes to Consolidated Financial Statements included elsewhere in this Annual Report), repurchases of
our common stock and cash used to pay dividends to our stockholders. Our working capital may be impacted by some of the aforementioned factors in future
periods, certain amounts and timing of which are variable.
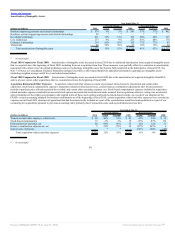
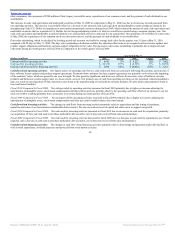
The increase in working capital as of May 31, 2009 in comparison to May 31, 2008 was due to the favorable impact to our net current assets resulting from our
net income during fiscal 2009. This increase in working capital was partially offset by an increase in our stock repurchases during fiscal 2009 in comparison to
the prior year (we used $4.0 billion of cash for stock repurchases during fiscal 2009 in comparison to $2.0 billion used for stock repurchases during fiscal 2008),
cash used for our acquisitions, cash used to repay $1.0 billion of our senior notes that matured in May 2009 and the reclassification of $1.0 billion of our senior
notes due May 2010 as a current liability, cash used to pay dividends to our stockholders for the first time in our history, and the decline in value of our net
current assets held by certain of our foreign subsidiaries as a result of the strengthening of the U.S. Dollar during fiscal 2009 (the offset to which was recorded to
accumulated other comprehensive income in our consolidated balance sheet).
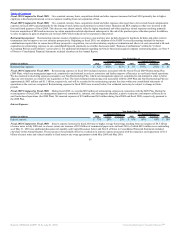
Cash, cash equivalents and marketable securities: Cash and cash equivalents primarily consist of deposits held at major banks, money market funds, Tier-1
commercial paper, U.S. Treasury obligations, U.S. government agency and government sponsored enterprise obligations, and other securities with original
maturities of 90 days or less. Marketable securities primarily consist of time deposits held at major banks, Tier-1 commercial paper, corporate notes, U.S.
Treasury obligations, U.S. government agency and government sponsored enterprise obligations and certain other securities. The increase in cash, cash
equivalents and marketable securities at May 31, 2010 in comparison to May 31, 2009 was primarily due to cash generated from our operating activities and our
issuance of $4.5 billion of senior notes in July 2009. Cash, cash equivalents and marketable securities included $16.6 billion held by our foreign subsidiaries as of
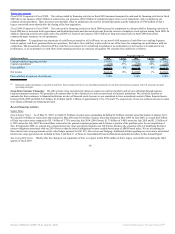
May 31, 2010. The amount of cash, cash equivalents and marketable securities that we report in U.S. Dollars for a significant portion of the cash held by these
subsidiaries is subject to translation adjustments caused by changes in foreign currency exchange rates as of the end of each respective reporting period (the
offset to which is recorded to accumulated other comprehensive income in our consolidated balance sheet). As the U.S. Dollar strengthened against certain major
international currencies as of the end of fiscal 2010, the amount of cash, cash equivalents and marketable securities that we reported in U.S. Dollars for these
subsidiaries decreased as of May 31, 2010 relative to what we would have reported using a constant currency rate as of May 31, 2009. Our increase in cash, cash
equivalents and marketable securities balances were partially offset by $5.6 billion of net cash used for our acquisition of Sun and
67
Source: ORACLE CORP, 10-K, July 01, 2010 Powered by Morningstar® Document Research℠