Oracle 2009 Annual Report Download - page 36
Download and view the complete annual report
Please find page 36 of the 2009 Oracle annual report below. You can navigate through the pages in the report by either clicking on the pages listed below, or by using the keyword search tool below to find specific information within the annual report.-
 1
1 -
2
-
3
-
4
-
5
-
6
-
7
-
8
-
9
-
10
-
11
-
12
-
13
-
14
-
15
-
16
-
17
-
18
-
19
-
20
-
21
-
22
-
23
-
24
-
25
-
 26
26 -
 27
27 -
 28
28 -
 29
29 -
 30
30 -
 31
31 -
 32
32 -
 33
33 -
 34
34 -
 35
35 -
 36
36 -
 37
37 -
 38
38 -
 39
39 -
 40
40 -
 41
41 -
 42
42 -
 43
43 -
 44
44 -
 45
45 -
 46
46 -
47
-
48
-
49
-
50
-
51
-
52
-
53
-
54
-
55
-
56
-
57
-
58
-
59
-
60
-
61
-
62
-
63
-
64
-
65
-
66
-
67
-
68
-
69
-
70
-
71
-
72
-
73
-
74
-
75
-
76
-
77
-
78
-
79
-
80
-
81
-
82
-
83
-
84
-
85
-
86
-
87
-
88
-
89
-
90
-
91
-
92
-
93
-
94
-
95
-
96
-
97
-
98
-
99
-
100
-
101
-
102
-
103
-
104
-
105
-
106
-
107
-
108
-
109
-
110
-
111
-
112
-
113
-
114
-
115
-
116
-
117
-
118
-
119
-
120
-
121
-
122
-
123
-
124
-
125
-
126
-
127
-
128
-
129
-
130
-
131
-
132
-
133
-
134
-
135
-
136
-
137
-
138
-
139
-
140
-
141
-
142
-
143
-
144
-
145
-
146
-
147
-
148
-
149
-
150
-
151
-
152
-
153
-
154
-
155
-
156
-
157
-
158
-
159
-
160
-
161
-
162
-
163
-
164
-
165
-
166
-
167
-
168
-
169
-
170
-
171
-
172
-
173
-
174
-
175
-
176
-
177
-
178
-
179
-
180
-
181
-
182
-
183
-
184
-
185
-
186
-
187
-
188
-
189
-
190
-
191
-
192
-
193
-
194
-
195
-
196
-
197
-
198
-
199
-
200
-
201
-
202
-
203
-
204
-
205
-
206
-
207
-
208
-
209
-
210
-
211
-
212
-
213
-
214
-
215
-
216
-
217
-
218
-
219
-
220
-
221
-
222
-
223
-
224
 |
 |

Table of Contents
Item 6. Selected Financial Data
The following table sets forth selected financial data as of and for the last five fiscal years. This selected financial data should be read in conjunction with the
consolidated financial statements and related notes included in Item 15 of this Annual Report. Over the last five fiscal years, we have acquired a number of
companies including Sun Microsystems, Inc. in fiscal 2010, BEA Systems, Inc. in fiscal 2008, Hyperion Solutions Corporation in fiscal 2007 and Siebel
Systems, Inc. in fiscal 2006. The results of our acquired companies have been included in our consolidated financial statements since their respective dates of
acquisition and have contributed to our growth in revenues, income and earnings per share.
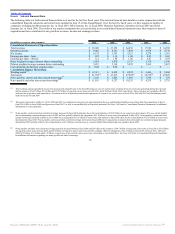
As of and for the Year Ended May 31,
(in millions, except per share amounts) 2010 2009 2008 2007 2006
Consolidated Statements of Operations Data:
Total revenues $ 26,820 $ 23,252 $ 22,430 $ 17,996 $ 14,380
Operating income $ 9,062 $ 8,321 $ 7,844 $ 5,974 $ 4,736
Net income $ 6,135 $ 5,593 $ 5,521 $ 4,274 $ 3,381
Earnings per share—basic $ 1.22 $ 1.10 $ 1.08 $ 0.83 $ 0.65
Earnings per share—diluted $ 1.21 $ 1.09 $ 1.06 $ 0.81 $ 0.64
Basic weighted average common shares outstanding 5,014 5,070 5,133 5,170 5,196
Diluted weighted average common shares outstanding 5,073 5,130 5,229 5,269 5,287
Cash dividends declared per common share $ 0.20 $ 0.05 $ — $ — $ —
Consolidated Balance Sheets Data:
Working capital(1) $ 12,313 $ 9,432 $ 8,074 $ 3,496 $ 5,044
Total assets $ 61,578(2) $ 47,416 $ 47,268(2) $ 34,572(2) $ 29,029
Notes payable, current and other current borrowings(3) $ 3,145 $ 1,001 $ 1,001 $ 1,358 $ 159
Notes payable and other non-current borrowings(4) $ 11,510 $ 9,237 $ 10,235 $ 6,235 $ 5,735
(1) Total working capital sequentially increased in most periods primarily due to the favorable impact to our net current assets resulting from our net income generated during these periods
and the issuance of $4.5 billion, $5.0 billion and $5.75 billion of long-term senior notes in fiscal 2010, fiscal 2008 and fiscal 2006, respectively. These increases were partially offset by
cash used for acquisitions and repurchases of common stock in all periods presented and repayments of certain of our senior notes in fiscal 2010, 2009 and 2007 and dividend payments
made in fiscal 2010 and 2009.
(2) Total assets increased as of May 31, 2010, 2008 and 2007 in comparison to the prior year period primarily due to goodwill and intangible assets arising from the acquisitions of Sun in
fiscal 2010, BEA in fiscal 2008 and Hyperion in fiscal 2007, as well as our profitability in all periods presented. See Note 2 of Notes to Consolidated Financial Statements for additional
information on our acquisitions.
(3) Notes payable, current and other current borrowings increased in fiscal 2010 primarily due to the reclassification of $2.2 billion of our senior notes due January 2011 as a current liability
and our outstanding commercial paper notes of $881 million, partially offset by the repayment of $1.0 billion of senior notes that matured in May 2010. Notes payable, current and other
current borrowings remained constant in fiscal 2009 due to repayment of $1.0 billion of senior notes that matured in May 2009 offset by the reclassification of $1.0 billion of senior notes
that matured in fiscal 2010. Notes payable, current and other current borrowings decreased in fiscal 2008 due to repayments of amounts borrowed under our commercial paper program
during fiscal 2007 partially offset by the reclassification of $1.0 billion of senior notes as a current liability that matured and were repaid in fiscal 2009.
(4) Notes payable and other non-current borrowings generally increased between fiscal 2006 and 2010 due to the issuances of $4.5 billion of long-term senior notes in fiscal 2010, $5.0 billion
of long-term senior notes in fiscal 2008, and $2.0 billion of long-term senior notes in fiscal 2007, partially offset by redemptions of $1.5 billion in fiscal 2007. In fiscal 2010, 2009 and
2008, $2.2 billion, $1.0 billion and $1.0 billion, respectively, of non-current senior notes were reclassified as current liabilities. See Note 8 of Notes to Consolidated Financial Statements
for additional information regarding our notes payable and other borrowings.
32
Source: ORACLE CORP, 10-K, July 01, 2010 Powered by Morningstar® Document Research℠