Oracle 2009 Annual Report Download - page 65
Download and view the complete annual report
Please find page 65 of the 2009 Oracle annual report below. You can navigate through the pages in the report by either clicking on the pages listed below, or by using the keyword search tool below to find specific information within the annual report.-
 1
1 -
2
-
3
-
4
-
5
-
6
-
7
-
8
-
9
-
10
-
11
-
12
-
13
-
14
-
15
-
16
-
17
-
18
-
19
-
20
-
21
-
22
-
23
-
24
-
25
-
26
-
27
-
28
-
29
-
30
-
31
-
32
-
33
-
34
-
35
-
36
-
37
-
38
-
39
-
40
-
41
-
42
-
43
-
44
-
45
-
46
-
47
-
48
-
49
-
50
-
51
-
52
-
53
-
54
-
 55
55 -
 56
56 -
 57
57 -
 58
58 -
 59
59 -
 60
60 -
 61
61 -
 62
62 -
 63
63 -
 64
64 -
 65
65 -
 66
66 -
 67
67 -
 68
68 -
 69
69 -
 70
70 -
 71
71 -
 72
72 -
 73
73 -
 74
74 -
 75
75 -
76
-
77
-
78
-
79
-
80
-
81
-
82
-
83
-
84
-
85
-
86
-
87
-
88
-
89
-
90
-
91
-
92
-
93
-
94
-
95
-
96
-
97
-
98
-
99
-
100
-
101
-
102
-
103
-
104
-
105
-
106
-
107
-
108
-
109
-
110
-
111
-
112
-
113
-
114
-
115
-
116
-
117
-
118
-
119
-
120
-
121
-
122
-
123
-
124
-
125
-
126
-
127
-
128
-
129
-
130
-
131
-
132
-
133
-
134
-
135
-
136
-
137
-
138
-
139
-
140
-
141
-
142
-
143
-
144
-
145
-
146
-
147
-
148
-
149
-
150
-
151
-
152
-
153
-
154
-
155
-
156
-
157
-
158
-
159
-
160
-
161
-
162
-
163
-
164
-
165
-
166
-
167
-
168
-
169
-
170
-
171
-
172
-
173
-
174
-
175
-
176
-
177
-
178
-
179
-
180
-
181
-
182
-
183
-
184
-
185
-
186
-
187
-
188
-
189
-
190
-
191
-
192
-
193
-
194
-
195
-
196
-
197
-
198
-
199
-
200
-
201
-
202
-
203
-
204
-
205
-
206
-
207
-
208
-
209
-
210
-
211
-
212
-
213
-
214
-
215
-
216
-
217
-
218
-
219
-
220
-
221
-
222
-
223
-
224
 |
 |

Table of Contents
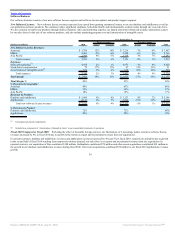
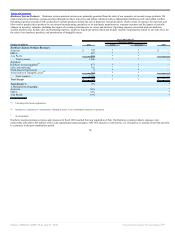
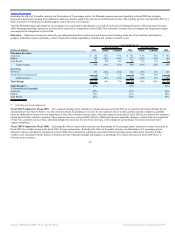
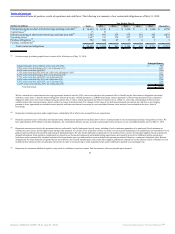
that are delivered either at our data center facilities, at select partner data centers, or physically on-site at customer facilities. Advanced Customer Services
consists of solution lifecycle management services, database and application management services, industry-specific solution support centers and remote and
on-site expert services. As a result of our acquisition of Sun, we increased the volume and breadth of our Advanced Customer Services offerings, including onsite
and remote operations management, hardware systems expert services, and packaged offerings that support the installation and optimization of Sun systems. The
cost of providing On Demand services consists primarily of personnel related expenditures, technology infrastructure expenditures and facilities costs.
Year Ended May 31,
2010
Percent Change
2009
Percent Change
2008
(Dollars in millions) Actual Constant Actual Constant
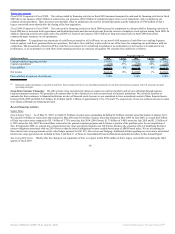
On Demand Revenues:
Americas $ 445 3% 2% $ 432 15% 18% $ 375
EMEA 295 28% 30% 230 2% 13% 226
Asia Pacific 134 15% 8% 117 26% 33% 93
Total revenues 874 12% 11% 779 12% 18% 694
Expenses:
Services(1)
696 12% 11% 621 -2% 4% 632
Stock-based compensation 5 22% 22% 4 -9% -9% 5
Amortization of intangible assets(2) 20 44% 44% 13 -1% -1% 14
Total expenses 721 13% 11% 638 -2% 3% 651
Total Margin $ 153 9% 8% $ 141 228% 225% $ 43
Total Margin % 18% 18% 6%
% Revenues by Geography:
Americas 51% 55% 54%
EMEA 34% 30% 33%
Asia Pacific 15% 15% 13%
(1) Excluding stock-based compensation
(2) Included as a component of ‘Amortization of Intangible Assets’ in our consolidated statements of operations
Fiscal 2010 Compared to Fiscal 2009: Excluding the effect of currency rate fluctuations, the increase in our On Demand revenues was primarily due to
revenue contributions from Sun and increased revenues from our legacy Advanced Customer Services offerings. These increases were partially offset by
modestly lower revenues in our legacy Oracle On Demand business. Excluding the effect of currency rate fluctuations, the Americas contributed 11%, EMEA
contributed 78% and Asia Pacific contributed 11% to the increase in our On Demand revenues.
On a constant currency basis, On Demand expenses increased primarily due to Sun and were partially offset by lower expenses from our legacy On Demand
operations, primarily reduced employee related expenses.
On a constant currency basis, On Demand margin increased primarily due to expense reductions in our legacy On Demand operations.
Fiscal 2009 Compared to Fiscal 2008: On Demand revenue growth was unfavorably affected by foreign currency rate fluctuations of 6 percentage points in
fiscal 2009. On Demand revenues increased in fiscal 2009 due to an increase in each service category’s subscription base as a greater number of customers
engaged us to provide IT services and outsourcing solutions. On a constant currency basis, Advanced Customer Services contributed the majority of our On
Demand revenues growth. Excluding the effect of currency rate fluctuations, the Americas contributed 52%, EMEA contributed 23% and Asia Pacific
contributed 25% to the increase in On Demand revenues.
61
Source: ORACLE CORP, 10-K, July 01, 2010 Powered by Morningstar® Document Research℠