Oracle 2009 Annual Report Download - page 67
Download and view the complete annual report
Please find page 67 of the 2009 Oracle annual report below. You can navigate through the pages in the report by either clicking on the pages listed below, or by using the keyword search tool below to find specific information within the annual report.-
 1
1 -
2
-
3
-
4
-
5
-
6
-
7
-
8
-
9
-
10
-
11
-
12
-
13
-
14
-
15
-
16
-
17
-
18
-
19
-
20
-
21
-
22
-
23
-
24
-
25
-
26
-
27
-
28
-
29
-
30
-
31
-
32
-
33
-
34
-
35
-
36
-
37
-
38
-
39
-
40
-
41
-
42
-
43
-
44
-
45
-
46
-
47
-
48
-
49
-
50
-
51
-
52
-
53
-
54
-
55
-
56
-
 57
57 -
 58
58 -
 59
59 -
 60
60 -
 61
61 -
 62
62 -
 63
63 -
 64
64 -
 65
65 -
 66
66 -
 67
67 -
 68
68 -
 69
69 -
 70
70 -
 71
71 -
 72
72 -
 73
73 -
 74
74 -
 75
75 -
 76
76 -
 77
77 -
78
-
79
-
80
-
81
-
82
-
83
-
84
-
85
-
86
-
87
-
88
-
89
-
90
-
91
-
92
-
93
-
94
-
95
-
96
-
97
-
98
-
99
-
100
-
101
-
102
-
103
-
104
-
105
-
106
-
107
-
108
-
109
-
110
-
111
-
112
-
113
-
114
-
115
-
116
-
117
-
118
-
119
-
120
-
121
-
122
-
123
-
124
-
125
-
126
-
127
-
128
-
129
-
130
-
131
-
132
-
133
-
134
-
135
-
136
-
137
-
138
-
139
-
140
-
141
-
142
-
143
-
144
-
145
-
146
-
147
-
148
-
149
-
150
-
151
-
152
-
153
-
154
-
155
-
156
-
157
-
158
-
159
-
160
-
161
-
162
-
163
-
164
-
165
-
166
-
167
-
168
-
169
-
170
-
171
-
172
-
173
-
174
-
175
-
176
-
177
-
178
-
179
-
180
-
181
-
182
-
183
-
184
-
185
-
186
-
187
-
188
-
189
-
190
-
191
-
192
-
193
-
194
-
195
-
196
-
197
-
198
-
199
-
200
-
201
-
202
-
203
-
204
-
205
-
206
-
207
-
208
-
209
-
210
-
211
-
212
-
213
-
214
-
215
-
216
-
217
-
218
-
219
-
220
-
221
-
222
-
223
-
224
 |
 |
Table of Contents
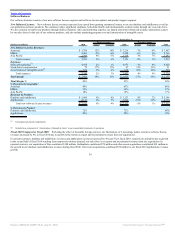
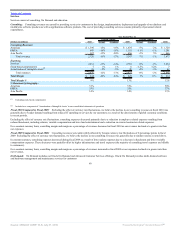
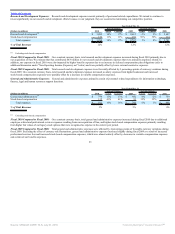
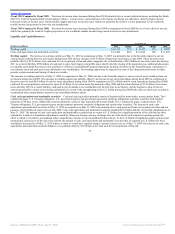
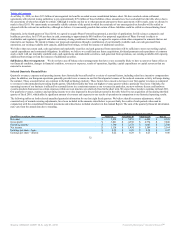
Research and Development Expenses: Research and development expenses consist primarily of personnel related expenditures. We intend to continue to
invest significantly in our research and development efforts because, in our judgment, they are essential to maintaining our competitive position.
Year Ended May 31,
2010
Percent Change
2009
Percent Change
2008
(Dollars in millions) Actual Constant Actual Constant
Research and development(1) $ 3,082 18% 17% $ 2,612 -1% 2% $ 2,627
Stock-based compensation 172 11% 11% 155 36% 36% 114
Total expenses $ 3,254 18% 17% $ 2,767 1% 4% $ 2,741
% of Total Revenues 12% 12% 12%
(1) Excluding stock-based compensation
Fiscal 2010 Compared to Fiscal 2009: On a constant currency basis, total research and development expenses increased during fiscal 2010 primarily due to
our acquisition of Sun. We estimate that Sun contributed $476 million to our research and development expenses that were primarily employee related. In
addition, our expenses in fiscal 2010 were also impacted by higher benefits expenses due to an increase in deferred compensation plan obligations (refer to
additional discussion under “Non-Operating Income (Expense), net” below) and were partially offset by lower external contractor expenses.
Fiscal 2009 Compared to Fiscal 2008: Total research and development expenses were favorably affected by 3 percentage points of currency variations during
fiscal 2009. On a constant currency basis, total research and development expenses increased as salary expenses from higher headcount and increased
stock-based compensation expenses were partially offset by a decrease in variable compensation expenses.
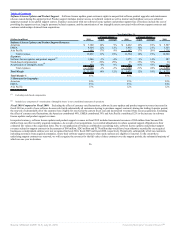
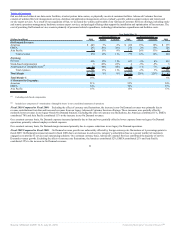
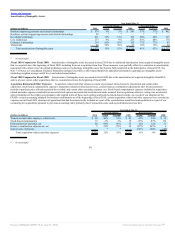
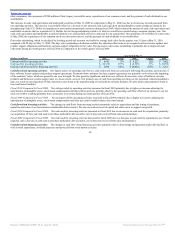
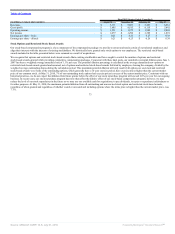
General and Administrative Expenses: General and administrative expenses primarily consist of personnel related expenditures for information technology,
finance, legal and human resources support functions.
Year Ended May 31,
2010
Percent Change Percent Change
(Dollars in millions) Actual Constant 2009 Actual Constant 2008
General and administrative(1) $ 779 13% 13% $ 692 -6% -2% $ 739
Stock-based compensation 132 41% 41% 93 35% 35% 69
Total expenses $ 911 16% 16% $ 785 -3% 1% $ 808
% of Total Revenues 3% 3% 4%
(1) Excluding stock-based compensation
Fiscal 2010 Compared to Fiscal 2009: On a constant currency basis, total general and administrative expenses increased during fiscal 2010 due to additional
employee related and professional services expenses resulting from our acquisition of Sun, and higher stock-based compensation expenses primarily resulting
from higher fair values of our legacy stock options that were recognized as expense in the current year period.
Fiscal 2009 Compared to Fiscal 2008: Total general and administrative expenses were affected by 4 percentage points of favorable currency variations during
fiscal 2009. Excluding the effect of currency rate fluctuations, general and administrative expenses increased slightly during fiscal 2009 as a result of increased
professional services fees and increased stock-based compensation expenses, which were almost entirely offset by decreases in variable compensation expenses
and certain of our benefits expenses.
63
Source: ORACLE CORP, 10-K, July 01, 2010 Powered by Morningstar® Document Research℠