Oracle 2009 Annual Report Download - page 198
Download and view the complete annual report
Please find page 198 of the 2009 Oracle annual report below. You can navigate through the pages in the report by either clicking on the pages listed below, or by using the keyword search tool below to find specific information within the annual report.-
 1
1 -
2
-
3
-
4
-
5
-
6
-
7
-
8
-
9
-
10
-
11
-
12
-
13
-
14
-
15
-
16
-
17
-
18
-
19
-
20
-
21
-
22
-
23
-
24
-
25
-
26
-
27
-
28
-
29
-
30
-
31
-
32
-
33
-
34
-
35
-
36
-
37
-
38
-
39
-
40
-
41
-
42
-
43
-
44
-
45
-
46
-
47
-
48
-
49
-
50
-
51
-
52
-
53
-
54
-
55
-
56
-
57
-
58
-
59
-
60
-
61
-
62
-
63
-
64
-
65
-
66
-
67
-
68
-
69
-
70
-
71
-
72
-
73
-
74
-
75
-
76
-
77
-
78
-
79
-
80
-
81
-
82
-
83
-
84
-
85
-
86
-
87
-
88
-
89
-
90
-
91
-
92
-
93
-
94
-
95
-
96
-
97
-
98
-
99
-
100
-
101
-
102
-
103
-
104
-
105
-
106
-
107
-
108
-
109
-
110
-
111
-
112
-
113
-
114
-
115
-
116
-
117
-
118
-
119
-
120
-
121
-
122
-
123
-
124
-
125
-
126
-
127
-
128
-
129
-
130
-
131
-
132
-
133
-
134
-
135
-
136
-
137
-
138
-
139
-
140
-
141
-
142
-
143
-
144
-
145
-
146
-
147
-
148
-
149
-
150
-
151
-
152
-
153
-
154
-
155
-
156
-
157
-
158
-
159
-
160
-
161
-
162
-
163
-
164
-
165
-
166
-
167
-
168
-
169
-
170
-
171
-
172
-
173
-
174
-
175
-
176
-
177
-
178
-
179
-
180
-
181
-
182
-
183
-
184
-
185
-
186
-
187
-
 188
188 -
 189
189 -
 190
190 -
 191
191 -
 192
192 -
 193
193 -
 194
194 -
 195
195 -
 196
196 -
 197
197 -
 198
198 -
 199
199 -
 200
200 -
 201
201 -
 202
202 -
 203
203 -
 204
204 -
 205
205 -
 206
206 -
 207
207 -
 208
208 -
209
-
210
-
211
-
212
-
213
-
214
-
215
-
216
-
217
-
218
-
219
-
220
-
221
-
222
-
223
-
224
 |
 |

FAIR VALUE MEASUREMENTS
FAIR VALUE MEASUREMENTS
(USD $)
12 Months Ended
05/31/2010
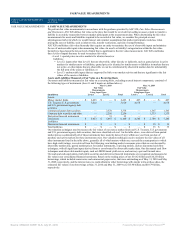
FAIR VALUE MEASUREMENTS 4. FAIR VALUE MEASUREMENTS
We perform fair value measurements in accordance with the guidance provided by ASC 820, Fair Value Measurements
and Disclosures. ASC 820 defines fair value as the price that would be received from selling an asset or paid to transfer a
liability in an orderly transaction between market participants at the measurement date. When determining the fair value
measurements for assets and liabilities required to be recorded at fair value, we consider the principal or most
advantageous market in which we would transact and consider assumptions that market participants would use when
pricing the asset or liability, such as inherent risk, transfer restrictions, and risk of nonperformance.
ASC 820 establishes a fair value hierarchy that requires an entity to maximize the use of observable inputs and minimize
the use of unobservable inputs when measuring fair value. An asset's or liability's categorization within the fair value
hierarchy is based upon the lowest level of input that is significant to the fair value measurement. ASC 820 establishes
three levels of inputs that may be used to measure fair value:
• Level 1: quoted prices in active markets for identical assets or
liabilities;
• Level 2: inputs other than Level 1 that are observable, either directly or indirectly, such as quoted prices in active
markets for similar assets or liabilities, quoted prices for identical or similar assets or liabilities in markets that are
not active, or other inputs that are observable or can be corroborated by observable market data for substantially
the full term of the assets or liabilities; or
• Level 3: unobservable inputs that are supported by little or no market activity and that are significant to the fair
values of the assets or liabilities.
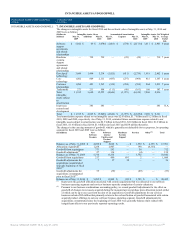
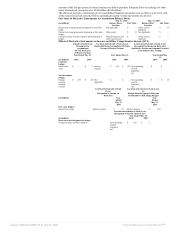
Assets and Liabilities Measured at Fair Value on a Recurring Basis
Our assets and liabilities measured at fair value on a recurring basis, excluding accrued interest components, consisted of
the following types of instruments (Level 1 and 2 inputs are defined above):
May 31, 2010 May 31, 2009
Fair Value
Measurements
Using Input Types
Fair Value
Measurements
Using Input Types
(in millions) Level 1 Level 2 Total Level 1 Level 2 Total
Assets:
Money market funds $ 2,423 $ — $ 2,423 $ 467 $ — $ 467
U.S. Treasury, U.S. government
and U.S. government agency debt
securities
3,010 — 3,010 4,078 — 4,078
Commercial paper debt securities — 3,378 3,378 — 1,365 1,365
Corporate debt securities and other — 2,256 2,256 — 1,335 1,335
Derivative financial instruments — 33 33 — — —
Total assets $ 5,433 $ 5,667 $ 11,100 $ 4,545 $ 2,700 $ 7,245
Liabilities:
Derivative financial instruments $ — $ — $ — $ — $ 35 $ 35
Total liabilities $ — $ — $ — $ — $ 35 $ 35
Our valuation techniques used to measure the fair values of our money market funds and U.S. Treasury, U.S. government
and U.S. government agency debt securities, that were classified as Level 1 in the table above, were derived from quoted
market prices as substantially all of these instruments have maturity dates (if any) within one year from our date of
purchase and active markets for these instruments exist. Our valuation techniques used to measure the fair values of all
other instruments listed in the table above, generally all of which mature within one year and the counterparties to which
have high credit ratings, were derived from the following: non-binding market consensus prices that are corroborated by
observable market data, quoted market prices for similar instruments, or pricing models, such as discounted cash flow
techniques, with all significant inputs derived from or corroborated by observable market data. Our discounted cash flow
techniques used observable market inputs, such as LIBOR-based yield curves, and currency spot and forward rates.
Our cash and cash equivalents, marketable securities and derivative financial instruments are recognized and measured at
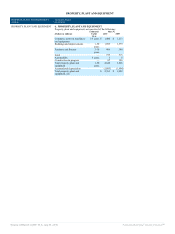
fair value in our consolidated financial statements. Based on the trading prices of our $14.62 billion and $10.25 billion
borrowings, which included senior notes and commercial paper notes, that were outstanding as of May 31, 2010 and May
31, 2009, respectively, and the interest rates we could obtain for other borrowings with similar terms at those dates, the
estimated fair values of our borrowings at May 31, 2010 and May 31, 2009 were $15.90 billion and $10.79 billion,
respectively.
Source: ORACLE CORP, 10-K, July 01, 2010 Powered by Morningstar® Document Research℠