Oracle 2009 Annual Report Download - page 72
Download and view the complete annual report
Please find page 72 of the 2009 Oracle annual report below. You can navigate through the pages in the report by either clicking on the pages listed below, or by using the keyword search tool below to find specific information within the annual report.-
 1
1 -
2
-
3
-
4
-
5
-
6
-
7
-
8
-
9
-
10
-
11
-
12
-
13
-
14
-
15
-
16
-
17
-
18
-
19
-
20
-
21
-
22
-
23
-
24
-
25
-
26
-
27
-
28
-
29
-
30
-
31
-
32
-
33
-
34
-
35
-
36
-
37
-
38
-
39
-
40
-
41
-
42
-
43
-
44
-
45
-
46
-
47
-
48
-
49
-
50
-
51
-
52
-
53
-
54
-
55
-
56
-
57
-
58
-
59
-
60
-
61
-
 62
62 -
 63
63 -
 64
64 -
 65
65 -
 66
66 -
 67
67 -
 68
68 -
 69
69 -
 70
70 -
 71
71 -
 72
72 -
 73
73 -
 74
74 -
 75
75 -
 76
76 -
 77
77 -
 78
78 -
 79
79 -
 80
80 -
 81
81 -
 82
82 -
83
-
84
-
85
-
86
-
87
-
88
-
89
-
90
-
91
-
92
-
93
-
94
-
95
-
96
-
97
-
98
-
99
-
100
-
101
-
102
-
103
-
104
-
105
-
106
-
107
-
108
-
109
-
110
-
111
-
112
-
113
-
114
-
115
-
116
-
117
-
118
-
119
-
120
-
121
-
122
-
123
-
124
-
125
-
126
-
127
-
128
-
129
-
130
-
131
-
132
-
133
-
134
-
135
-
136
-
137
-
138
-
139
-
140
-
141
-
142
-
143
-
144
-
145
-
146
-
147
-
148
-
149
-
150
-
151
-
152
-
153
-
154
-
155
-
156
-
157
-
158
-
159
-
160
-
161
-
162
-
163
-
164
-
165
-
166
-
167
-
168
-
169
-
170
-
171
-
172
-
173
-
174
-
175
-
176
-
177
-
178
-
179
-
180
-
181
-
182
-
183
-
184
-
185
-
186
-
187
-
188
-
189
-
190
-
191
-
192
-
193
-
194
-
195
-
196
-
197
-
198
-
199
-
200
-
201
-
202
-
203
-
204
-
205
-
206
-
207
-
208
-
209
-
210
-
211
-
212
-
213
-
214
-
215
-
216
-
217
-
218
-
219
-
220
-
221
-
222
-
223
-
224
 |
 |

Table of Contents
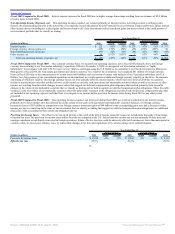
other companies, the repayment of $700 million of Sun’s legacy convertible notes, repurchases of our common stock, and the payment of cash dividends to our
stockholders.
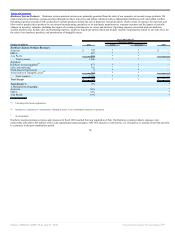
The increase in cash, cash equivalents and marketable securities at May 31, 2009 in comparison to May 31, 2008 was due to an increase in cash generated from
our operating activities. This increase was partially offset by a decrease in our reported cash, cash equivalent and marketable securities balances caused by the
strengthening of the U.S. Dollar in comparison to most major international currencies during fiscal 2009, which reduced the amount of cash, cash equivalents and
marketable securities that we reported in U.S. Dollars for our foreign subsidiaries relative to what we would have reported using a constant currency rate. Our
cash, cash equivalents and marketable securities balances were also partially offset by cash used for our acquisitions, the repayment of $1.0 billion of senior notes
in May 2009, the repurchases of our common stock (see discussion above), and the payment of cash dividends to our stockholders.
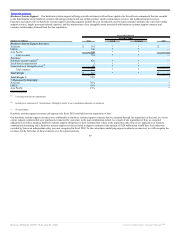
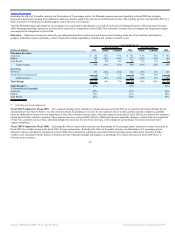
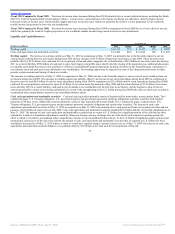
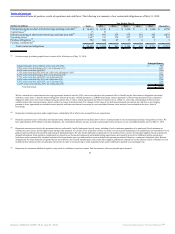
Days sales outstanding, which is calculated by dividing period end accounts receivable by average daily sales for the quarter, was 53 days at May 31, 2010
compared with 58 days at May 31, 2009. The days sales outstanding calculation excludes the adjustment that reduces our acquired software license updates and
product support obligations and hardware systems support obligations to fair value. Our decrease in days sales outstanding is primarily due to improved cash
collections during the fourth quarter of fiscal 2010 in comparison to the fourth quarter of fiscal 2009.
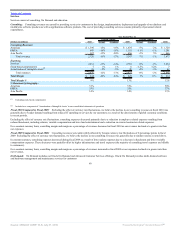
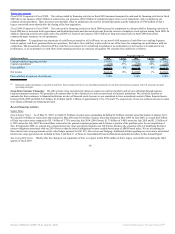
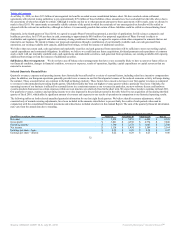
Year Ended May 31,
(Dollars in millions) 2010 Change 2009 Change 2008
Cash provided by operating activities $ 8,681 5% $ 8,255 12% $ 7,402
Cash used for investing activities $ (10,319) 297% $ (2,599) -71% $ (9,076)
Cash provided by (used for) financing activities $ 2,664 160% $ (4,422) -235% $ 3,281
Cash flows from operating activities: Our largest source of operating cash flows is cash collections from our customers following the purchase and renewal of
their software license updates and product support agreements. Payments from customers for these support agreements are generally received near the beginning
of the contracts’ terms, which are generally one year in length. We also generate significant cash from new software license sales, sales of hardware systems
products and hardware systems support and, to a lesser extent, services. Our primary uses of cash from operating activities are for personnel related expenditures
and, as a result of our acquisition of Sun, materials costs related to the manufacturing of our hardware systems products. We also make cash payments related to
taxes and leased facilities.
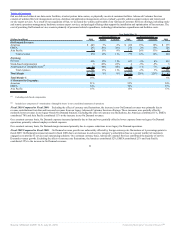
Fiscal 2010 Compared to Fiscal 2009: Net cash provided by operating activities increased in fiscal 2010 primarily due to higher net income adjusting for
amortization of intangible assets, stock-based compensation and depreciation and was partially offset by the operating cash flow effects of an increase to our net
trade receivables resulting primarily from an increase in revenues during our fourth quarter of fiscal 2010.
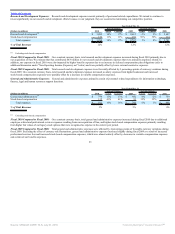
Fiscal 2009 Compared to Fiscal 2008: Net cash provided by operating activities increased in fiscal 2009 primarily due to higher net income adjusting for
amortization of intangible assets, stock-based compensation and other net cash favorable balance sheet movements.
Cash flows from investing activities: The changes in cash flows from investing activities primarily relate to acquisitions and the timing of purchases,
maturities and sales of our investments in marketable debt securities. We also use cash to invest in capital and other assets to support our growth.
Fiscal 2010 Compared to Fiscal 2009: Net cash used for investing activities increased in fiscal 2010 due to an increase in cash used for acquisitions, primarily
our acquisition of Sun, and cash used to purchase marketable debt securities (net of proceeds received from sales and maturities).
Fiscal 2009 Compared to Fiscal 2008: Net cash used for investing activities decreased in fiscal 2009 due to a decrease in cash used for acquisitions, net of cash
acquired, and a decrease in cash used to purchase marketable debt securities, net of proceeds received from sales and maturities.
Cash flows from financing activities: The changes in cash flows from financing activities primarily relate to borrowings and payments under debt facilities as
well as stock repurchases, dividend payments and proceeds from stock option exercises.
68
Source: ORACLE CORP, 10-K, July 01, 2010 Powered by Morningstar® Document Research℠