Oracle 2009 Annual Report Download - page 70
Download and view the complete annual report
Please find page 70 of the 2009 Oracle annual report below. You can navigate through the pages in the report by either clicking on the pages listed below, or by using the keyword search tool below to find specific information within the annual report.-
 1
1 -
2
-
3
-
4
-
5
-
6
-
7
-
8
-
9
-
10
-
11
-
12
-
13
-
14
-
15
-
16
-
17
-
18
-
19
-
20
-
21
-
22
-
23
-
24
-
25
-
26
-
27
-
28
-
29
-
30
-
31
-
32
-
33
-
34
-
35
-
36
-
37
-
38
-
39
-
40
-
41
-
42
-
43
-
44
-
45
-
46
-
47
-
48
-
49
-
50
-
51
-
52
-
53
-
54
-
55
-
56
-
57
-
58
-
59
-
 60
60 -
 61
61 -
 62
62 -
 63
63 -
 64
64 -
 65
65 -
 66
66 -
 67
67 -
 68
68 -
 69
69 -
 70
70 -
 71
71 -
 72
72 -
 73
73 -
 74
74 -
 75
75 -
 76
76 -
 77
77 -
 78
78 -
 79
79 -
 80
80 -
81
-
82
-
83
-
84
-
85
-
86
-
87
-
88
-
89
-
90
-
91
-
92
-
93
-
94
-
95
-
96
-
97
-
98
-
99
-
100
-
101
-
102
-
103
-
104
-
105
-
106
-
107
-
108
-
109
-
110
-
111
-
112
-
113
-
114
-
115
-
116
-
117
-
118
-
119
-
120
-
121
-
122
-
123
-
124
-
125
-
126
-
127
-
128
-
129
-
130
-
131
-
132
-
133
-
134
-
135
-
136
-
137
-
138
-
139
-
140
-
141
-
142
-
143
-
144
-
145
-
146
-
147
-
148
-
149
-
150
-
151
-
152
-
153
-
154
-
155
-
156
-
157
-
158
-
159
-
160
-
161
-
162
-
163
-
164
-
165
-
166
-
167
-
168
-
169
-
170
-
171
-
172
-
173
-
174
-
175
-
176
-
177
-
178
-
179
-
180
-
181
-
182
-
183
-
184
-
185
-
186
-
187
-
188
-
189
-
190
-
191
-
192
-
193
-
194
-
195
-
196
-
197
-
198
-
199
-
200
-
201
-
202
-
203
-
204
-
205
-
206
-
207
-
208
-
209
-
210
-
211
-
212
-
213
-
214
-
215
-
216
-
217
-
218
-
219
-
220
-
221
-
222
-
223
-
224
 |
 |

Table of Contents
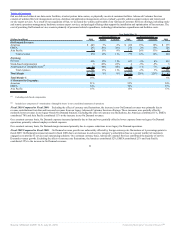
Fiscal 2009 Compared to Fiscal 2008: Interest expense increased in fiscal 2009 due to higher average borrowings resulting from our issuance of $5.0 billion
of senior notes in April 2008.
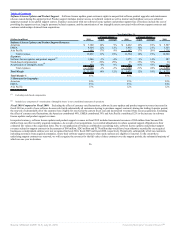
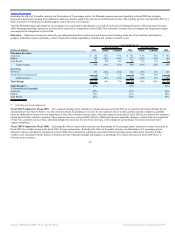
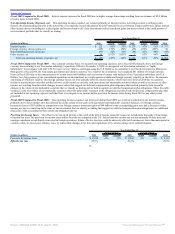
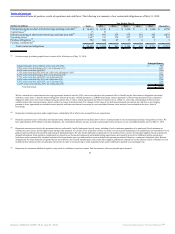
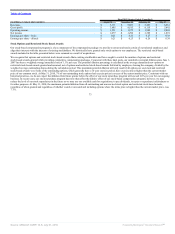
Non-Operating Income (Expense), net: Non-operating income (expense), net consists primarily of interest income, net foreign currency exchange gains
(losses), the noncontrolling interests in the net profits of our majority-owned subsidiaries (Oracle Financial Services Software Limited and Oracle Japan), and net
other income (losses) including net realized gains and losses related to all of our investments and net unrealized gains and losses related to the small portion of
our investment portfolio that we classify as trading.
Year Ended May 31,
2010
Percent Change
2009
Percent Change
2008
(Dollars in millions) Actual Constant Actual Constant
Interest income $ 122 -56% -57% $ 279 -17% -11% $ 337
Foreign currency (losses) gains, net (148) -170% -170% (55) -236% -203% 40
Noncontrolling interests in income (95) -12% -11% (84) -41% -48% (60)
Other income, net 56 1,192% 1,055% 3 -95% -96% 67
Total non-operating income (expense), net $ (65) -145% -144% $ 143 -63% -54% $ 384
Fiscal 2010 Compared to Fiscal 2009: On a constant currency basis, we incurred non-operating expenses, net in fiscal 2010 primarily due to net foreign
currency losses relating to our Venezuelan subsidiary’s operations. Effective December 1, 2009, we designated our Venezuelan subsidiary as “highly
inflationary” in accordance with ASC 830, Foreign Currency Matters, and began using the U.S. Dollar as the subsidiary’s new functional currency. During our
third quarter of fiscal 2010, the Venezuelan government devalued its currency. As a result of the devaluation, we recognized $81 million of foreign currency
losses in fiscal 2010 due to the remeasurement of certain assets and liabilities and conversion of certain cash balances of our Venezuelan subsidiary into U.S.
Dollars. As a large portion of our consolidated operations are international, we could experience additional foreign currency volatility in the future, the amounts
and timing of which are variable. Our foreign currency losses, net were partially offset by interest income, which was lower in fiscal 2010 due to a general
decline in market interest rates that resulted in lower yields earned on our cash, cash equivalents and marketable securities balances and by an increase in other
income, net resulting from favorable changes in asset values that support our deferred compensation plan obligations that resulted primarily from favorable
changes in the values of our marketable securities that we classify as trading and are held to support our deferred compensation plan obligations. These favorable
variances in the asset values of our marketable securities offset the unfavorable variances in the obligations associated with our deferred compensation plan that
are included in our operating expenses such that there is no impact to our income before provision for income taxes during fiscal 2010 or any other period
presented.
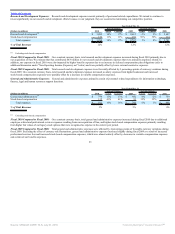
Fiscal 2009 Compared to Fiscal 2008: Non-operating income (expense), net decreased during fiscal 2009 as a result of a reduction in our interest income,
primarily due to lower market rates that affected the yields earned on our cash, cash equivalents and marketable securities balances, net foreign currency
transaction losses of $55 million in comparison to net foreign currency transaction gains of $40 million in the corresponding prior year and a decrease in other
income, net due to a reduction in the value of our investments that we classify as trading that support our deferred compensation plan obligations (see additional
discussion of the accounting for these assets and obligations above).
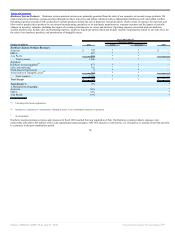
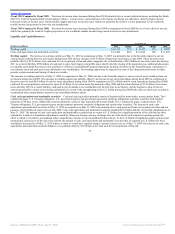
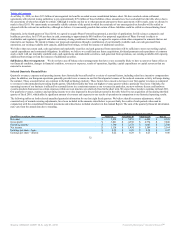
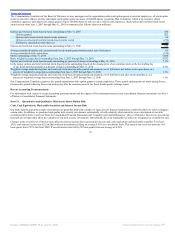
Provision for Income Taxes: Our effective tax rate in all periods is the result of the mix of income earned in various tax jurisdictions that apply a broad range
of income tax rates. The provision for income taxes differs from the tax computed at the U.S. federal statutory income tax rate due primarily to state taxes and
earnings considered as indefinitely reinvested in foreign operations. Future effective tax rates could be adversely affected if earnings are lower than anticipated in
countries where we have lower statutory rates, by unfavorable changes in tax laws and regulations or by adverse rulings in tax related litigation.
Year Ended May 31,
2010
Percent Change
2009
Percent Change
2008
(Dollars in millions) Actual Constant Actual Constant
Provision for income taxes $ 2,108 -6% -9% $ 2,241 -3% 6% $ 2,313
Effective tax rate 25.6% 28.6% 29.5%
66
Source: ORACLE CORP, 10-K, July 01, 2010 Powered by Morningstar® Document Research℠