Oracle 2009 Annual Report Download - page 64
Download and view the complete annual report
Please find page 64 of the 2009 Oracle annual report below. You can navigate through the pages in the report by either clicking on the pages listed below, or by using the keyword search tool below to find specific information within the annual report.-
 1
1 -
2
-
3
-
4
-
5
-
6
-
7
-
8
-
9
-
10
-
11
-
12
-
13
-
14
-
15
-
16
-
17
-
18
-
19
-
20
-
21
-
22
-
23
-
24
-
25
-
26
-
27
-
28
-
29
-
30
-
31
-
32
-
33
-
34
-
35
-
36
-
37
-
38
-
39
-
40
-
41
-
42
-
43
-
44
-
45
-
46
-
47
-
48
-
49
-
50
-
51
-
52
-
53
-
 54
54 -
 55
55 -
 56
56 -
 57
57 -
 58
58 -
 59
59 -
 60
60 -
 61
61 -
 62
62 -
 63
63 -
 64
64 -
 65
65 -
 66
66 -
 67
67 -
 68
68 -
 69
69 -
 70
70 -
 71
71 -
 72
72 -
 73
73 -
 74
74 -
75
-
76
-
77
-
78
-
79
-
80
-
81
-
82
-
83
-
84
-
85
-
86
-
87
-
88
-
89
-
90
-
91
-
92
-
93
-
94
-
95
-
96
-
97
-
98
-
99
-
100
-
101
-
102
-
103
-
104
-
105
-
106
-
107
-
108
-
109
-
110
-
111
-
112
-
113
-
114
-
115
-
116
-
117
-
118
-
119
-
120
-
121
-
122
-
123
-
124
-
125
-
126
-
127
-
128
-
129
-
130
-
131
-
132
-
133
-
134
-
135
-
136
-
137
-
138
-
139
-
140
-
141
-
142
-
143
-
144
-
145
-
146
-
147
-
148
-
149
-
150
-
151
-
152
-
153
-
154
-
155
-
156
-
157
-
158
-
159
-
160
-
161
-
162
-
163
-
164
-
165
-
166
-
167
-
168
-
169
-
170
-
171
-
172
-
173
-
174
-
175
-
176
-
177
-
178
-
179
-
180
-
181
-
182
-
183
-
184
-
185
-
186
-
187
-
188
-
189
-
190
-
191
-
192
-
193
-
194
-
195
-
196
-
197
-
198
-
199
-
200
-
201
-
202
-
203
-
204
-
205
-
206
-
207
-
208
-
209
-
210
-
211
-
212
-
213
-
214
-
215
-
216
-
217
-
218
-
219
-
220
-
221
-
222
-
223
-
224
 |
 |

Table of Contents
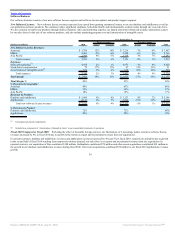
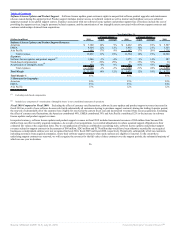
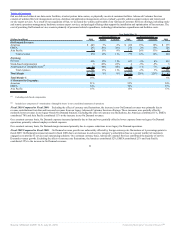
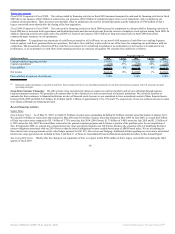
Services
Services consist of consulting, On Demand and education.
Consulting: Consulting revenues are earned by providing services to customers in the design, implementation, deployment and upgrade of our database and
middleware software products as well as applications software products. The cost of providing consulting services consists primarily of personnel related
expenditures.
Year Ended May 31,
2010
Percent Change
2009
Percent Change
2008
(Dollars in millions) Actual Constant Actual Constant
Consulting Revenues:
Americas $ 1,390 -15% -16% $ 1,639 -5% -2% $ 1,720
EMEA 943 -18% -18% 1,152 -11% -1% 1,291
Asia Pacific 387 -15% -20% 456 -2% 5% 466
Total revenues 2,720 -16% -17% 3,247 -7% -1% 3,477
Expenses:
Services(1)
2,431 -13% -14% 2,781 -8% -2% 3,014
Stock-based compensation 7 1% 1% 6 -12% -12% 7
Amortization of intangible assets(2) 38 -5% -5% 40 -4% -3% 42
Total expenses 2,476 -12% -13% 2,827 -8% -2% 3,063
Total Margin $ 244 -42% -44% $ 420 1% 11% $ 414
Total Margin % 9% 13% 12%
% Revenues by Geography:
Americas 51% 51% 50%
EMEA 35% 35% 37%
Asia Pacific 14% 14% 13%
(1) Excluding stock-based compensation
(2) Included as a component of ‘Amortization of Intangible Assets’ in our consolidated statements of operations
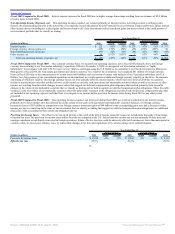
Fiscal 2010 Compared to Fiscal 2009: Excluding the effect of currency rate fluctuations, we believe the decline in our consulting revenues in fiscal 2010 was
generally due to weaker demand resulting from reduced IT spending on services by our customers as a result of the deterioration of global economic conditions
in recent periods.
Excluding the effect of currency rate fluctuations, consulting expenses decreased primarily due to a reduction in employee related expenses resulting from
reduced headcount, including salaries, variable compensation and travel and entertainment and a reduction in external contractor related expenses.
On a constant currency basis, consulting margin and margin as a percentage of revenues decreased in fiscal 2010 as our revenues declined at a greater rate than
our expenses.
Fiscal 2009 Compared to Fiscal 2008: Consulting revenues were unfavorably affected by foreign currency rate fluctuations of 6 percentage points in fiscal
2009. Excluding the effect of currency rate fluctuations, we believe the decline in our consulting revenues was generally due to similar reasons as noted above.
In constant currency, consulting expenses decreased during fiscal 2009 as a result of lower salary expenses due to a decrease in headcount and lower variable
compensation expenses. These decreases were partially offset by higher infrastructure and travel expenses (the majority of consulting travel expenses are billable
to customers).
On a constant currency basis, consulting margin and margin as a percentage of revenues increased in fiscal 2009 as our expenses declined at a greater rate than
our revenues.
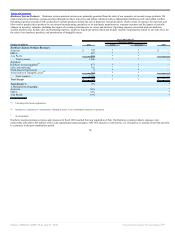
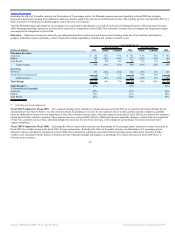
On Demand: On Demand includes our Oracle On Demand and Advanced Customer Services offerings. Oracle On Demand provides multi-featured software
and hardware management and maintenance services for customers
60
Source: ORACLE CORP, 10-K, July 01, 2010 Powered by Morningstar® Document Research℠