Nissan 2004 Annual Report Download - page 87
Download and view the complete annual report
Please find page 87 of the 2004 Nissan annual report below. You can navigate through the pages in the report by either clicking on the pages listed below, or by using the keyword search tool below to find specific information within the annual report.-
 1
1 -
2
-
3
-
4
-
5
-
6
-
7
-
8
-
9
-
10
-
11
-
12
-
13
-
14
-
15
-
16
-
17
-
18
-
19
-
20
-
21
-
22
-
23
-
24
-
25
-
26
-
27
-
28
-
29
-
30
-
31
-
32
-
33
-
34
-
35
-
36
-
37
-
38
-
39
-
40
-
41
-
42
-
43
-
44
-
45
-
46
-
47
-
48
-
49
-
50
-
51
-
52
-
53
-
54
-
55
-
56
-
57
-
58
-
59
-
60
-
61
-
62
-
63
-
64
-
65
-
66
-
67
-
68
-
69
-
70
-
71
-
72
-
73
-
74
-
75
-
76
-
 77
77 -
 78
78 -
 79
79 -
 80
80 -
 81
81 -
 82
82 -
 83
83 -
 84
84 -
 85
85 -
 86
86 -
 87
87 -
 88
88 -
 89
89 -
 90
90 -
 91
91 -
 92
92
 |
 |

Nissan Annual Report 2003 85
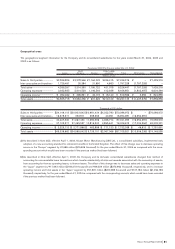
NON-CONSOLIDATED FIVE-YEAR SUMMARY
Nissan Motor Co., Ltd.
Fiscal years 2003,2002, 2001, 2000 and1999
Millions of
U.S. dollars(Note 1)
Millions of yen (except per
(except per share amounts and number of employees) share amounts)
2003 2002 2001 2000 1999 2003
For the years ended Mar. 31, 2004 Mar. 31, 2003 Mar. 31, 2002 Mar. 31, 2001 Mar. 31, 2000 Mar. 31, 2004
Net sales ¥3,480,290 ¥3,419,068 ¥3,019,860 ¥2,980,130 ¥2,997,020 $32,833
Operating income 245,836 316,059 242,279 127,762 (15,674) 2,319
Net income (loss) 80,713 72,869 183,449 187,485 (790,694) 761
Net income (loss) per share(Note 2) 18.15 16.09 45.61 47.14 (204.93) 0.17
Cash dividends paid(Note 3-4) 19.00 14.00 8.00 7.00 0.00 0.18
Shareholders’ equity ¥1,709,705 ¥1,798,716 ¥1,829,052 ¥1,450,159 ¥1,263,075 $16,129
Total assets 4,055,579 3,933,993 3,915,031 3,576,466 3,563,853 38,260
Long-term debt 653,392 902,118 942,518 798,009 909,178 6,164
Depreciation
and amortization 19,540 56,760 56,265 49,074 89,858 184
Number of employees 31,389 31,128 30,365 30,747 32,707
Notes: 1. Unless indicated otherwise, all dollar figures herein refer to U.S. currency. Yen amounts have been translated into U.S. dollars, for
convenience only, at ¥106=$1, the approximate exchange rate on March 31, 2004.
Notes: 2. Net income (loss) per share amounts are based on the weighted average number of shares of common stock outstanding during each year.
Figures for net income (loss) per share are in exact yen and U.S. dollars.
Number of shares outstanding as of March 31, 2004: 4,520,715,112.
Notes: 3. Cash dividends paid represent the amounts proposed by the Board of Directors as applicable to the respective years, together with the inter-
im cash dividends paid.
Notes: 4. Cash dividends applicable to fiscal year 2003 is ¥19.00 per share.