Nissan 2004 Annual Report Download - page 83
Download and view the complete annual report
Please find page 83 of the 2004 Nissan annual report below. You can navigate through the pages in the report by either clicking on the pages listed below, or by using the keyword search tool below to find specific information within the annual report.-
 1
1 -
2
-
3
-
4
-
5
-
6
-
7
-
8
-
9
-
10
-
11
-
12
-
13
-
14
-
15
-
16
-
17
-
18
-
19
-
20
-
21
-
22
-
23
-
24
-
25
-
26
-
27
-
28
-
29
-
30
-
31
-
32
-
33
-
34
-
35
-
36
-
37
-
38
-
39
-
40
-
41
-
42
-
43
-
44
-
45
-
46
-
47
-
48
-
49
-
50
-
51
-
52
-
53
-
54
-
55
-
56
-
57
-
58
-
59
-
60
-
61
-
62
-
63
-
64
-
65
-
66
-
67
-
68
-
69
-
70
-
71
-
72
-
 73
73 -
 74
74 -
 75
75 -
 76
76 -
 77
77 -
 78
78 -
 79
79 -
 80
80 -
 81
81 -
 82
82 -
 83
83 -
 84
84 -
 85
85 -
 86
86 -
 87
87 -
 88
88 -
 89
89 -
 90
90 -
 91
91 -
 92
92
 |
 |

Nissan Annual Report 2003 81
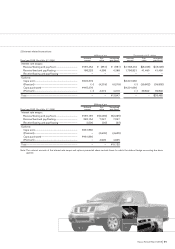
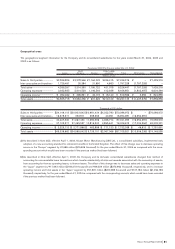
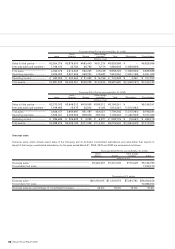
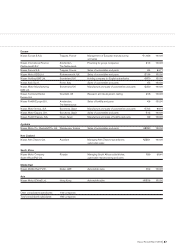
Geographical areas
The geographical segment information for the Company and its consolidated subsidiaries for the years ended March 31, 2004, 2003 and
2002 is as follows:
Fiscal year 2003 (For the year ended Mar. 31, 2004)
North Other foreign
Japan America Europe countries Total Eliminations Consolidated
Millions of yen
Sales to third parties.................. ¥2,559,806 ¥3,278,966 ¥1,164,032 ¥426,415 ¥7,429,219 ¥ – ¥7,429,219
Inter-area sales and transfers .. 1,725,491 35,384 31,690 4,663 1,797,228 (1,797,228) –
Total sales..................................... 4,285,297 3,314,350 1,195,722 431,078 9,226,447 (1,797,228) 7,429,219
Operating expenses................... 3,932,835 2,914,529 1,146,549 412,938 8,406,851 (1,802,487) 6,604,364
Operating income....................... ¥ 352,462 ¥ 399,821 ¥ 49,173 ¥ 18,140 ¥ 819,596 ¥ 5,259 ¥ 824,855
Total assets.................................. ¥4,805,718 ¥3,664,382 ¥ 607,926 ¥219,109 ¥9,297,135 ¥ (1,437,279) ¥7,859,856
Thousands of U.S. dollars
Sales to third parties.................. $24,149,113 $30,933,642 $10,981,434 $4,022,783 $70,086,972 $ – $70,086,972
Inter-area sales and transfers .. 16,278,217 333,811 298,962 43,991 16,954,981 (16,954,981) –
Total sales..................................... 40,427,330 31,267,453 11,280,396 4,066,774 87,041,953 (16,954,981) 70,086,972
Operating expenses................... 37,102,217 27,495,557 10,816,500 3,895,641 79,309,915 (17,004,594) 62,305,321
Operating income....................... $3,325,113 $ 3,771,896 $ 463,896 $ 171,133 $ 7,732,038 $ 49,613 $ 7,781,651
Total assets.................................. $45,336,962 $34,569,642 $ 5,735,151 $2,067,066 $87,708,821 $(13,559,236) $74,149,585
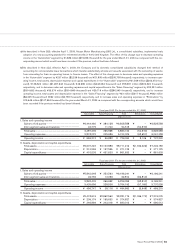
a) As described in Note 2(b), effective April 1, 2003, Nissan Motor Manufacturing (UK) Ltd., a consolidated subsidiary, implemented early
adoption of a new accounting standard for retirement benefits in the United Kingdom. The effect of this change was to decrease operating
income in the “Europe” segment by ¥1,686 million ($15,906 thousand) for the year ended March 31, 2004 as compared with the corre-
sponding amount which would have been recorded if the previous method had been followed.
b) As described in Note 2(c), effective April 1, 2003, the Company and its domestic consolidated subsidiaries changed their method of
accounting for noncancelable lease transactions which transfer substantially all risks and rewards associated with the ownership of assets,
from accounting for them as operating leases, to finance leases. The effect of this change was to decrease sales and operating expenses in
the “Japan” segment by ¥17,943 million ($169,273 thousand) and ¥39,534 million ($372,962 thousand), respectively, and to increase
operating income and total assets in the “Japan” segment by ¥21,591 million ($203,689 thousand) and ¥137,184 million ($1,294,189
thousand), respectively, for the year ended March 31, 2004 as compared with the corresponding amounts which would have been recorded
if the previous method had been followed.