Nissan 2004 Annual Report Download - page 84
Download and view the complete annual report
Please find page 84 of the 2004 Nissan annual report below. You can navigate through the pages in the report by either clicking on the pages listed below, or by using the keyword search tool below to find specific information within the annual report.-
 1
1 -
2
-
3
-
4
-
5
-
6
-
7
-
8
-
9
-
10
-
11
-
12
-
13
-
14
-
15
-
16
-
17
-
18
-
19
-
20
-
21
-
22
-
23
-
24
-
25
-
26
-
27
-
28
-
29
-
30
-
31
-
32
-
33
-
34
-
35
-
36
-
37
-
38
-
39
-
40
-
41
-
42
-
43
-
44
-
45
-
46
-
47
-
48
-
49
-
50
-
51
-
52
-
53
-
54
-
55
-
56
-
57
-
58
-
59
-
60
-
61
-
62
-
63
-
64
-
65
-
66
-
67
-
68
-
69
-
70
-
71
-
72
-
73
-
 74
74 -
 75
75 -
 76
76 -
 77
77 -
 78
78 -
 79
79 -
 80
80 -
 81
81 -
 82
82 -
 83
83 -
 84
84 -
 85
85 -
 86
86 -
 87
87 -
 88
88 -
 89
89 -
 90
90 -
 91
91 -
 92
92
 |
 |

Nissan Annual Report 2003
82
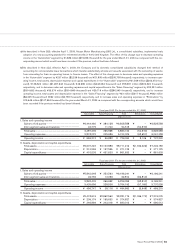
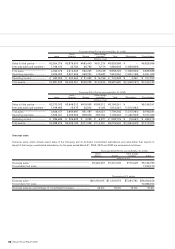
Fiscal year 2002 (For the year ended Mar. 31, 2003)
North Other foreign
Japan America Europe countries Total Eliminations Consolidated
Millions of yen
Sales to third parties ................... ¥2,554,374 ¥2,879,500 ¥963,440 ¥431,274 ¥6,828,588 ¥ – ¥6,828,588
Inter-area sales and transfers.... 1,766,102 32,763 26,765 4,174 1,829,804 (1,829,804) –
Total sales...................................... 4,320,476 2,912,263 990,205 435,448 8,658,392 (1,829,804) 6,828,588
Operating expenses .................... 3,929,920 2,607,699 968,253 418,682 7,924,554 (1,833,196) 6,091,358
Operating income ........................ ¥ 390,556 ¥ 304,564 ¥ 21,952 ¥ 16,766 ¥ 733,838 ¥ 3,392 ¥ 737,230
Total assets.................................... ¥4,881,842 ¥3,463,261 ¥502,028 ¥140,849 ¥8,987,980 ¥ (1,638,797) ¥7,349,183
Fiscal year 2001 (For the year ended Mar. 31, 2002)
North Other foreign
Japan America Europe countries Total Eliminations Consolidated
Millions of yen
Sales to third parties ................... ¥2,370,162 ¥2,649,212 ¥818,555
¥
358,312 ¥6,196,241 ¥ – ¥6,196,241
Inter-area sales and transfers.... 1,458,965 15,475 32,912 4,709 1,512,061 (1,512,061) –
Total sales...................................... 3,829,127 2,664,687 851,467 363,021 7,708,302 (1,512,061) 6,196,241
Operating expenses .................... 3,539,431 2,455,062 848,239 356,794 7,199,526 (1,492,500) 5,707,026
Operating income ........................ ¥ 289,696 ¥ 209,625 ¥ 3,228
¥6,227
¥ 508,776 ¥ (19,561) ¥ 489,215
Total assets.................................... ¥4,988,676 ¥3,506,180 ¥471,008
¥114,081
¥9,079,945 ¥ (1,864,940) ¥7,215,005
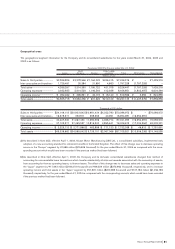
Overseas sales
Overseas sales, which include export sales of the Company and its domestic consolidated subsidiaries and sales (other than exports to
Japan) of the foreign consolidated subsidiaries, for the years ended March 31, 2004, 2003 and 2002 are summarized as follows:
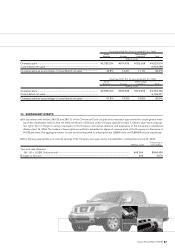
Fiscal year 2003 (For the year ended Mar. 31, 2004)
North Other foreign
America Europe countries Total
Millions of yen
Overseas sales.......................................................................................................... ¥3,222,497 ¥1,201,035 ¥773,248 ¥5,196,780
Consolidated net sales............................................................................................ 7,429,219
Thousands of U.S. dollars
Overseas sales.......................................................................................................... $30,400,915 $11,330,519 $7,294,792 $49,026,226
Consolidated net sales............................................................................................ 70,086,972
Overseas sales as a percentage of consolidated net sales ........................... 43.4% 16.2% 10.4% 70.0%