Nissan 2004 Annual Report Download - page 49
Download and view the complete annual report
Please find page 49 of the 2004 Nissan annual report below. You can navigate through the pages in the report by either clicking on the pages listed below, or by using the keyword search tool below to find specific information within the annual report.-
 1
1 -
2
-
3
-
4
-
5
-
6
-
7
-
8
-
9
-
10
-
11
-
12
-
13
-
14
-
15
-
16
-
17
-
18
-
19
-
20
-
21
-
22
-
23
-
24
-
25
-
26
-
27
-
28
-
29
-
30
-
31
-
32
-
33
-
34
-
35
-
36
-
37
-
38
-
 39
39 -
 40
40 -
 41
41 -
 42
42 -
 43
43 -
 44
44 -
 45
45 -
 46
46 -
 47
47 -
 48
48 -
 49
49 -
 50
50 -
 51
51 -
 52
52 -
 53
53 -
 54
54 -
 55
55 -
 56
56 -
 57
57 -
 58
58 -
 59
59 -
60
-
61
-
62
-
63
-
64
-
65
-
66
-
67
-
68
-
69
-
70
-
71
-
72
-
73
-
74
-
75
-
76
-
77
-
78
-
79
-
80
-
81
-
82
-
83
-
84
-
85
-
86
-
87
-
88
-
89
-
90
-
91
-
92
 |
 |
Nissan Annual Report 2003 47
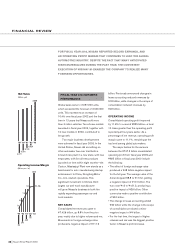
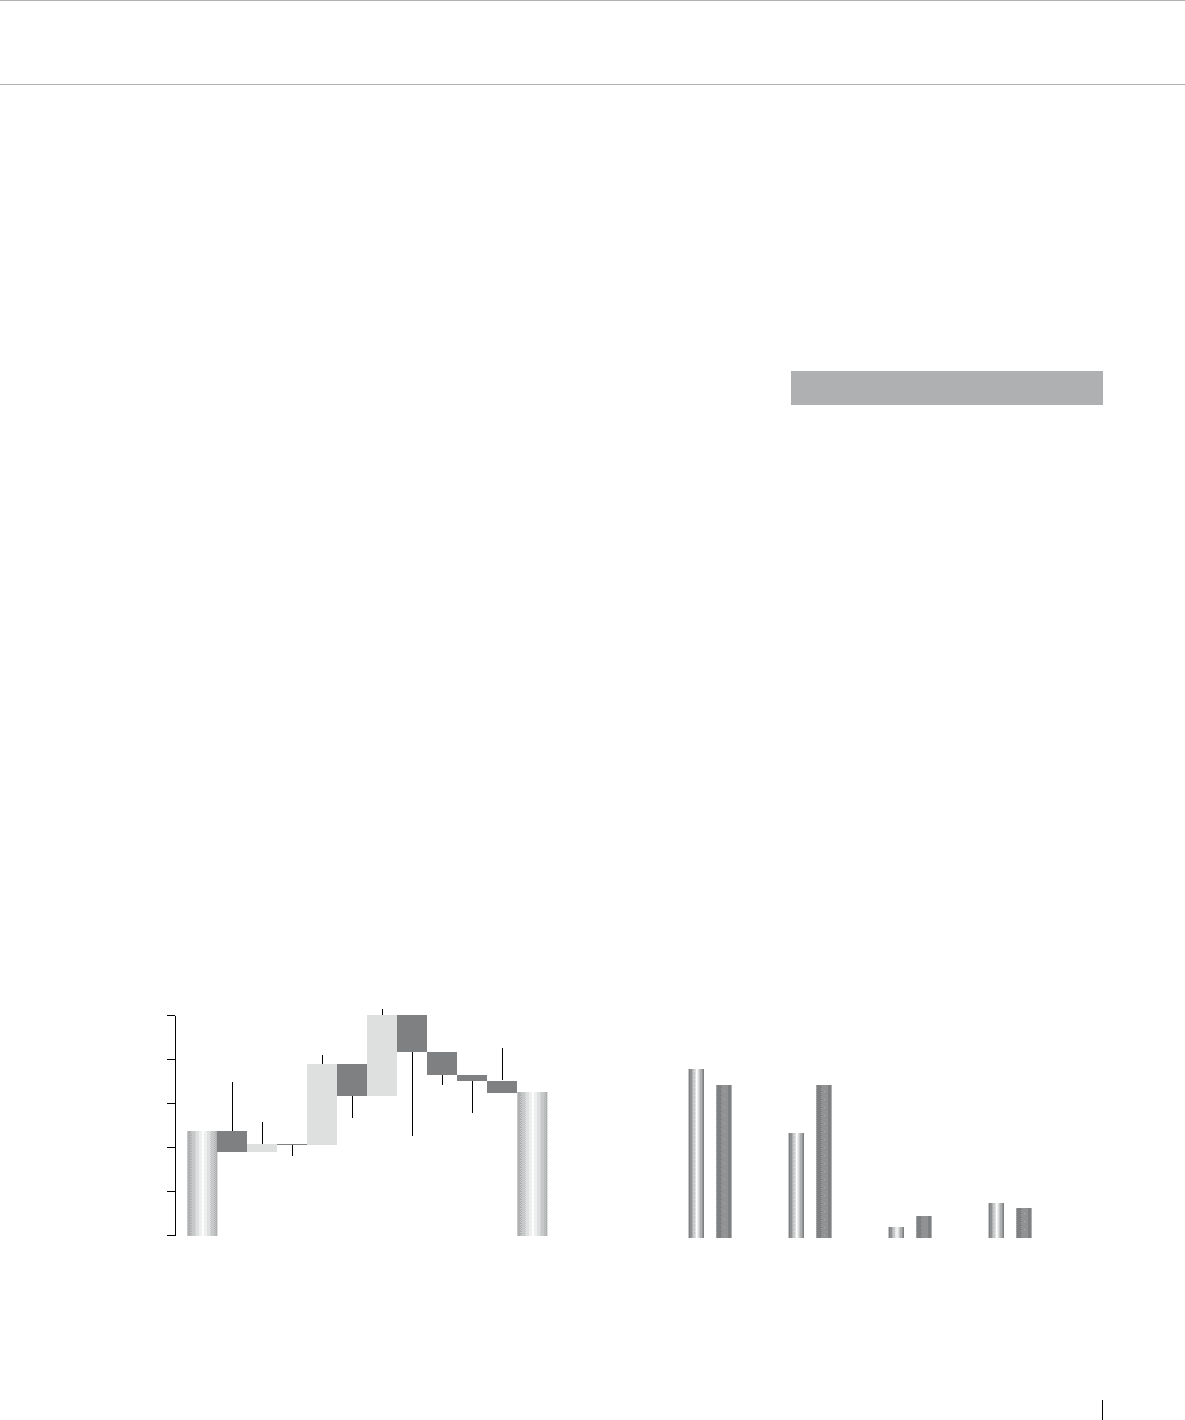
Impacts on Operating Profit
Fiscal year 2003 (Billion yen)
1,000
900
800
700
600
500
737.2
FY2002
Operating
Income
Foreign
exchange
-48
Lease
Accounting
+20
Volume/
Mix
+185
-83
Enrichment
& Regulations
Purchasing
cost
+183
825
FY2003
Operating
Income
G&A
Others
-27.3
-12
Manufacturing
cost
-54
R&D
-72
Sales
cost
increase
-4
Scope of
Consolidation
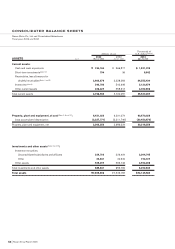
390.6
352.5
242.0
351.8
21.9
49.2
77.6 66.0
’02 ’03
Japan
’02 ’03
US
(including Canada)
’02 ’03
Europe
’02 ’03
Other Markets
(including Mexico)
Eliminations ’02 +5.1
’03 +5.4
Operating Income by Region
Fiscal years 2002-2003 (Billion yen)
contributing ¥185 billion.
• The increase in selling expenses by
¥72 billion.
• The improvement in purchasing costs
amounted to ¥183 billion.
• Product enrichment and cost of
regulations had a negative impact of
¥83 billion.
• An additional ¥54 billion was spent in
R&D to further reinforce product and
technology development.
• Manufacturing and logistics costs had
a negative impact of ¥12 billion, including
the costs associated with the startup of
the Canton Plant.
• General and administrative and other
expenses increased by ¥27.3 billion.
By region, operating profits in Japan
came to ¥352.5 billion, compared to
¥390.6 billion in the previous year.
The drop is primarily the result of higher
R&D expenses, the negative impact of
foreign exchange rates on export sales,
and a decrease in mix in the domestic
market. Profitability in the United States
and Canada came to ¥351.8 billion
compared to ¥242 billion in fiscal year
2002. This significant increase is due to
improvements in both volume and mix.
Europe’s operating profit level more than
doubled, to ¥49.2 billion from ¥21.9
billion. The rise is due to the increase in
volume and favorable exchange rates.
In General Overseas Markets, operating
profits came to ¥66 billion compared to
¥77.6 billion. The decrease is due to lower
profits in Mexico as a result of the decline
in Sentra exports to the United States.
Inter-regional eliminations came to
¥5.4 billion.
NET INCOME
Net non-operating expenses totaled ¥15.2
billion—¥12 billion less than in fiscal year
2002. As planned, the return of the
substitute portion of the pension plan to
the government decreased expenses by
¥10 billion. Financial costs decreased by
¥800 million to ¥15.7 billion despite the
announced incorporation on the balance
sheet of ¥133.7 billion in leases.
Ordinary profit came to ¥809.7 billion,
up from ¥710.1 billion in fiscal year 2002.
Net extraordinary losses grew by ¥57.7
billion, mainly due to the fact that last
year’s numbers included a one-time gain of
¥56.3 billion from the sale of the
Murayama Plant.
Income before taxes came to ¥736.5
billion. Taxes came to ¥219 billion for an
effective consolidated tax rate of 29.7% as
the company continues to optimize its
global net tax rate. Minority interests
amounted to ¥13.8 billion.
Net income reached ¥503.7 billion,
resulting in the best net result in the
company’s history.
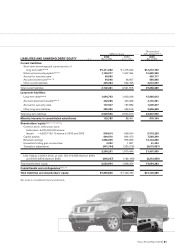
FINANCIAL POSITION
ASSETS
Total consolidated assets increased by
6.9% to ¥7.8599 trillion in fiscal year
2003, compared to ¥7.3492 trillion at the
end of fiscal year 2002.
Current assets increased by 1.8% or
¥66.9 billion during fiscal year 2003 to
¥3.767 trillion. Sales finance receivables
increased by ¥306.2 billion, while cash
and account receivables decreased
through more efficient working
capital management.
Fixed assets increased by 12.2% to
¥4.0913 trillion from ¥3.647 trillion.
Property, plant and equipment increased
by ¥213.9 billion, including the investment
in the new Canton, Mississippi plant.