Nissan 2004 Annual Report Download - page 76
Download and view the complete annual report
Please find page 76 of the 2004 Nissan annual report below. You can navigate through the pages in the report by either clicking on the pages listed below, or by using the keyword search tool below to find specific information within the annual report.-
 1
1 -
2
-
3
-
4
-
5
-
6
-
7
-
8
-
9
-
10
-
11
-
12
-
13
-
14
-
15
-
16
-
17
-
18
-
19
-
20
-
21
-
22
-
23
-
24
-
25
-
26
-
27
-
28
-
29
-
30
-
31
-
32
-
33
-
34
-
35
-
36
-
37
-
38
-
39
-
40
-
41
-
42
-
43
-
44
-
45
-
46
-
47
-
48
-
49
-
50
-
51
-
52
-
53
-
54
-
55
-
56
-
57
-
58
-
59
-
60
-
61
-
62
-
63
-
64
-
65
-
 66
66 -
 67
67 -
 68
68 -
 69
69 -
 70
70 -
 71
71 -
 72
72 -
 73
73 -
 74
74 -
 75
75 -
 76
76 -
 77
77 -
 78
78 -
 79
79 -
 80
80 -
 81
81 -
 82
82 -
 83
83 -
 84
84 -
 85
85 -
 86
86 -
87
-
88
-
89
-
90
-
91
-
92
 |
 |

Nissan Annual Report 2003
74
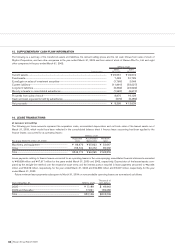
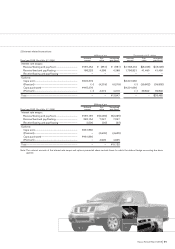
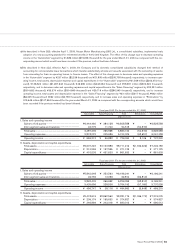
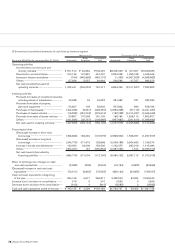
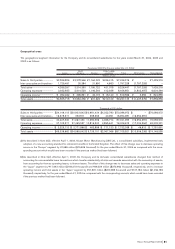
The following tables set forth the summarized financial statements by business segment for the years ended March 31, 2004, 2003 and
2002. Amounts for the sales financing segment represent the aggregate of the figures for the sales financing subsidiaries in Japan, the United
States, Canada and Mexico. Amounts for the automobile segment represent the differences between the consolidated totals and those for the
sales financing segment.
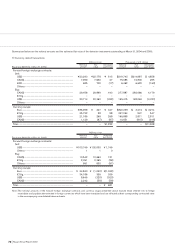
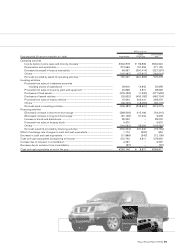
1) Summarized consolidated balance sheets by business segment
Millions of yen Thousands of U.S. dollars
Sales Consolidated Sales Consolidated
Fiscal year 2003 (As of Mar. 31, 2004) Automobile Financing total Automobile Financing total
Cash and cash equivalents.................................. ¥ 190,135 ¥ 4,029 ¥ 194,164 $ 1,793,727 $ 38,009 $ 1,831,736
Short-term investments......................................... 319 385 704 3,010 3,632 6,642
Receivables, less allowance for
doubtful receivables........................................ 246,310 2,356,566 2,602,876 2,323,679 22,231,755 24,555,434
Inventories................................................................ 536,172 6,620 542,792 5,058,226 62,453 5,120,679
Other current assets.............................................. 284,614 141,813 426,427 2,685,037 1,337,859 4,022,896
Total current assets ............................................... 1,257,550 2,509,413 3,766,963 11,863,679 23,673,708 35,537,387
Property, plant and equipment, net .................... 2,425,940 777,312 3,203,252 22,886,226 7,333,132 30,219,358
Investment securities............................................. 356,925 3,419 360,344 3,367,217 32,255 3,399,472
Other assets ............................................................ 340,270 189,027 529,297 3,210,095 1,783,273 4,993,368
Total assets.............................................................. ¥4,380,685 ¥3,479,171 ¥7,859,856 $41,327,217 $32,822,368 $74,149,585
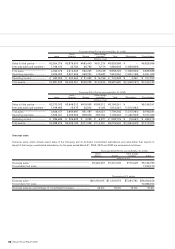
Short-term borrowings and current
portion of long-term debt ............................. ¥(565,677) ¥1,976,939 ¥1,411,262 $ (5,336,576) $18,650,368 $13,313,792
Notes and accounts payable............................... 1,086,094 40,183 1,126,277 10,246,170 379,085 10,625,255
Accrued income taxes........................................... 88,000 6,008 94,008 830,189 56,679 886,868
Other current liabilities.......................................... 428,791 42,143 470,934 4,045,198 397,576 4,442,774
Total current liabilities............................................ 1,037,208 2,065,273 3,102,481 9,784,981 19,483,708 29,268,689
Long-term debt ....................................................... 769,515 925,278 1,694,793 7,259,575 8,729,038 15,988,613
Other long-term liabilities ..................................... 743,539 191,264 934,803 7,014,519 1,804,377 8,818,896
Total long-term liabilities....................................... 1,513,054 1,116,542 2,629,596 14,274,094 10,533,415 24,807,509
Total liabilities.......................................................... 2,550,262 3,181,815 5,732,077 24,059,075 30,017,123 54,076,198
Minority interests .................................................... 103,785 – 103,785 979,104 – 979,104
Common stock........................................................ 520,692 85,122 605,814 4,912,188 803,038 5,715,226
Capital surplus ........................................................ 774,403 30,067 804,470 7,305,689 283,651 7,589,340
Retained earnings .................................................. 1,096,203 190,096 1,286,299 10,341,538 1,793,358 12,134,896
Unrealized holding gain on securities................ 4,211 181 4,392 39,726 1,708 41,434
Translation adjustments ........................................ (423,634) (8,110) (431,744) (3,996,547) (76,510) (4,073,057)
Treasury stock......................................................... (245,237) – (245,237) (2,313,556) –
(2,313,556)
Total shareholders’ equity..................................... 1,726,638 297,356 2,023,994 16,289,038 2,805,245
19,094,283
Total liabilities and shareholders’ equity ........... ¥4,380,685 ¥3,479,171 ¥7,859,856 $41,327,217 $32,822,368
$74,149,585