Nissan 2004 Annual Report Download - page 11
Download and view the complete annual report
Please find page 11 of the 2004 Nissan annual report below. You can navigate through the pages in the report by either clicking on the pages listed below, or by using the keyword search tool below to find specific information within the annual report.-
 1
1 -
 2
2 -
 3
3 -
 4
4 -
 5
5 -
 6
6 -
 7
7 -
 8
8 -
 9
9 -
 10
10 -
 11
11 -
 12
12 -
 13
13 -
 14
14 -
 15
15 -
 16
16 -
 17
17 -
 18
18 -
 19
19 -
 20
20 -
 21
21 -
 22
22 -
23
-
24
-
25
-
26
-
27
-
28
-
29
-
30
-
31
-
32
-
33
-
34
-
35
-
36
-
37
-
38
-
39
-
40
-
41
-
42
-
43
-
44
-
45
-
46
-
47
-
48
-
49
-
50
-
51
-
52
-
53
-
54
-
55
-
56
-
57
-
58
-
59
-
60
-
61
-
62
-
63
-
64
-
65
-
66
-
67
-
68
-
69
-
70
-
71
-
72
-
73
-
74
-
75
-
76
-
77
-
78
-
79
-
80
-
81
-
82
-
83
-
84
-
85
-
86
-
87
-
88
-
89
-
90
-
91
-
92
 |
 |
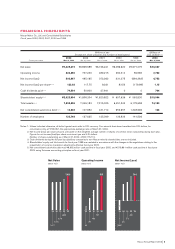
Nissan Annual Report 2003 9
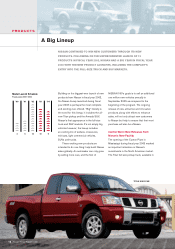
2002 2003 2004 2005
‘
2007
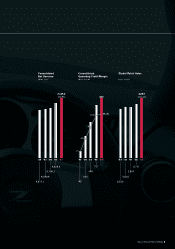
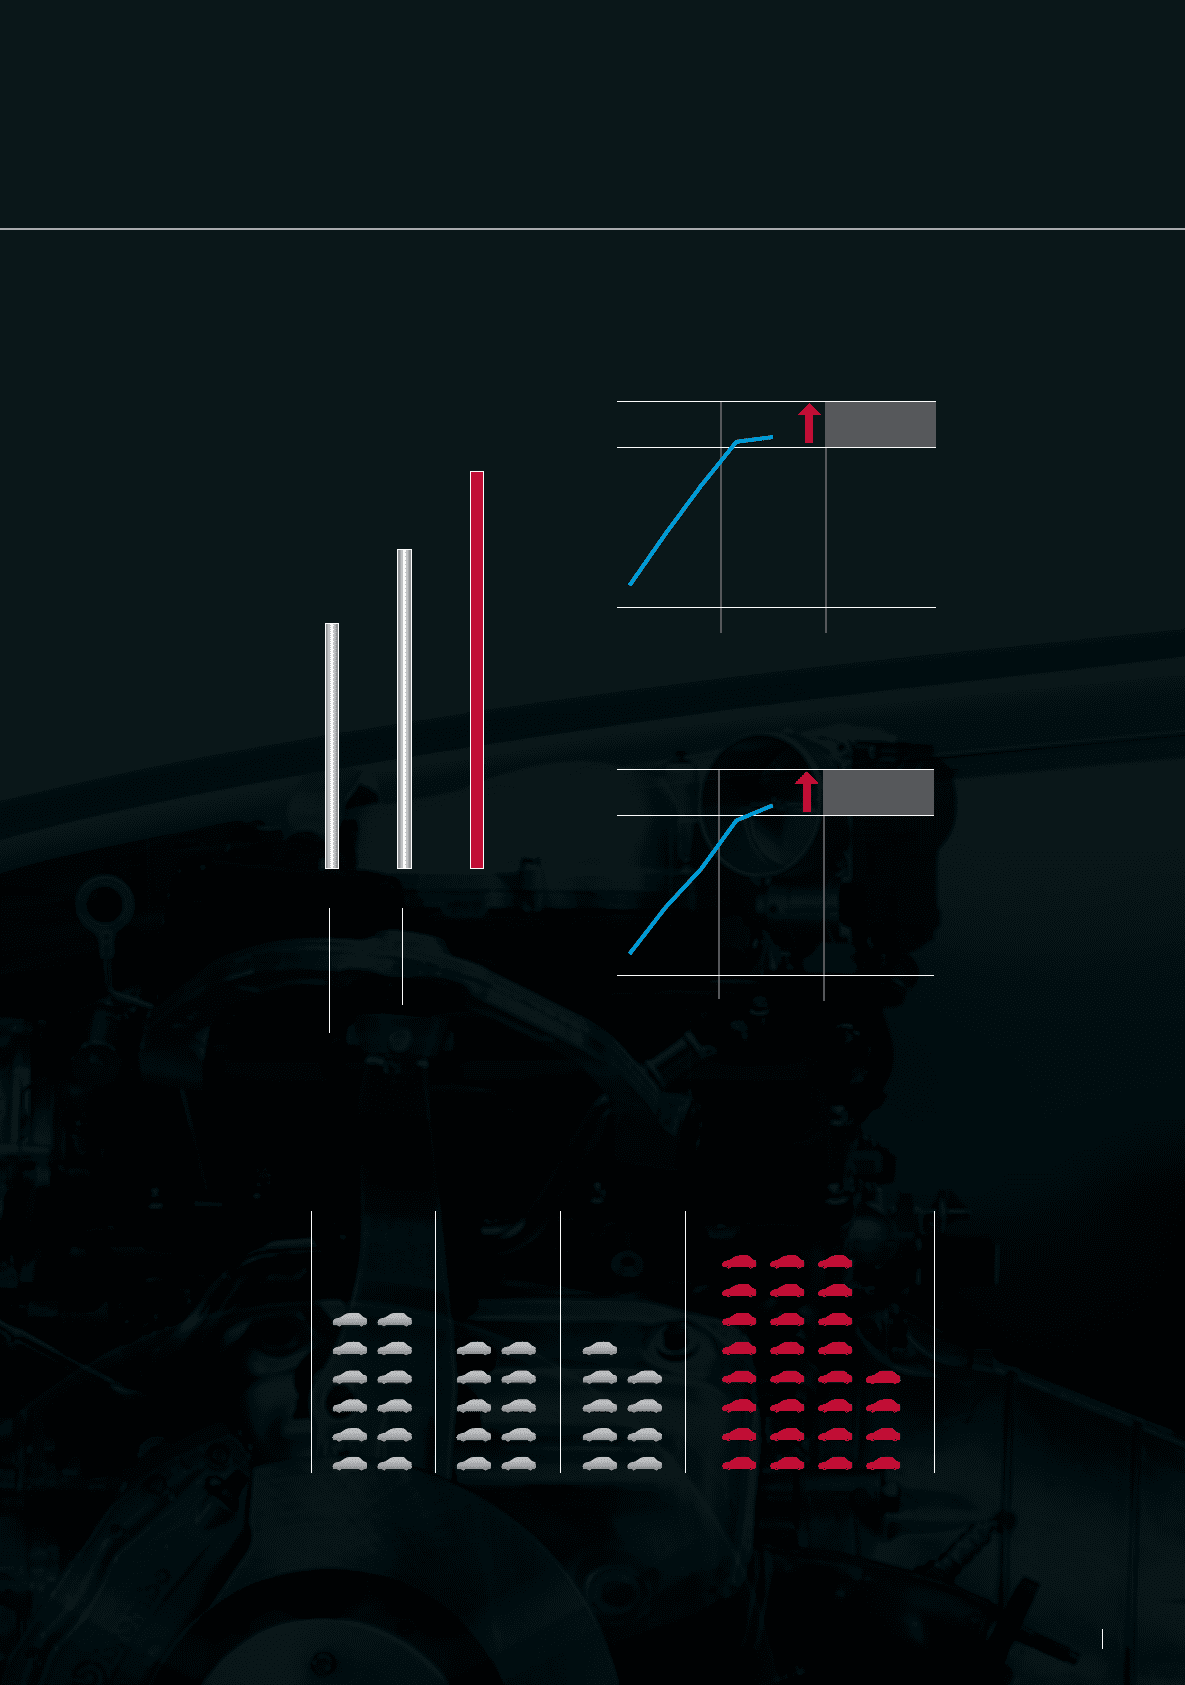
12 10 9 28
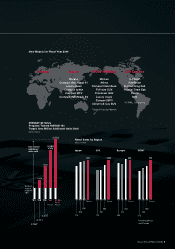
Model Launch Schedule, Fiscal Years 2002–2007
0
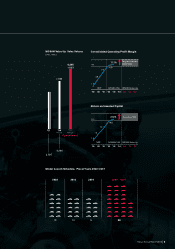
2,597
3,380
4,200
+820
+783
’01 ’04
Forecast
’07
Forecast
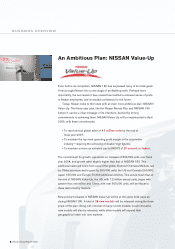
Commitment
NISSAN Value-Up Sales Volume
(Units: 1000s)
Consolidated Operating Profit Margin
’99 ’00 ’01 ’02 ’03 ’04 ’05 ’06 ’07
NRP NISSAN 180
NISSAN Value-Up
Top global automaker
(double-digit)
1.4
4.8
7.9
10.8
11.1%
10%
Return on Invested Capital
’99 ’00 ’01 ’02 ’03 ’04 ’05 ’06 ’07
NRP NISSAN 180
NISSAN Value-Up
At or above 20%
1.3
7.5
12.7
19.8
21.3%
20%