Nissan 2004 Annual Report Download - page 81
Download and view the complete annual report
Please find page 81 of the 2004 Nissan annual report below. You can navigate through the pages in the report by either clicking on the pages listed below, or by using the keyword search tool below to find specific information within the annual report.-
 1
1 -
2
-
3
-
4
-
5
-
6
-
7
-
8
-
9
-
10
-
11
-
12
-
13
-
14
-
15
-
16
-
17
-
18
-
19
-
20
-
21
-
22
-
23
-
24
-
25
-
26
-
27
-
28
-
29
-
30
-
31
-
32
-
33
-
34
-
35
-
36
-
37
-
38
-
39
-
40
-
41
-
42
-
43
-
44
-
45
-
46
-
47
-
48
-
49
-
50
-
51
-
52
-
53
-
54
-
55
-
56
-
57
-
58
-
59
-
60
-
61
-
62
-
63
-
64
-
65
-
66
-
67
-
68
-
69
-
70
-
 71
71 -
 72
72 -
 73
73 -
 74
74 -
 75
75 -
 76
76 -
 77
77 -
 78
78 -
 79
79 -
 80
80 -
 81
81 -
 82
82 -
 83
83 -
 84
84 -
 85
85 -
 86
86 -
 87
87 -
 88
88 -
 89
89 -
 90
90 -
 91
91 -
92
 |
 |
Nissan Annual Report 2003 79
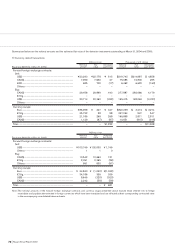
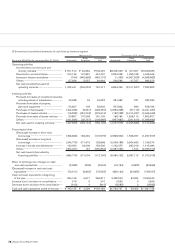
Millions of yen
Sales Consolidated
Fiscal year 2002 (For the year ended Mar. 31, 2003) Automobile Financing total
Operating activities
Income before income taxes and minority interests............................................................ ¥634,818 ¥ 59,806 ¥694,624
Depreciation and amortization ................................................................................................. 213,569 157,556 371,125
Decrease (increase) in finance receivables .......................................................................... 64,057 (391,414) (327,357)
Others............................................................................................................................................ (115,097) (47,917) (163,014)
Net cash provided by (used in) operating activities............................................................ 797,347 (221,969) 575,378
Investing activities
Proceeds from sales of investment securities
including shares of subsidiaries ....................................................................................... 39,816 13,842 53,658
Proceeds from sales of property, plant and equipment ..................................................... 94,828 3,871 98,699
Purchases of fixed assets ......................................................................................................... (376,429) (1,500) (377,929)
Purchases of leased vehicles................................................................................................... (33,522) (450,182) (483,704)
Proceeds from sales of leases vehicles................................................................................. 15,644 243,431 259,075
Others............................................................................................................................................ (46,720) (18,453) (65,173)
Net cash used in investing activities....................................................................................... (306,383) (208,991) (515,374)
Financing activities
(Decrease) increase in short-term borrowings .................................................................... (369,506) 315,196 (54,310)
(Decrease) increase in long-term borrowings...................................................................... (81,106) 91,044 9,938
Increase in bonds and debentures ......................................................................................... 85,000 – 85,000
Proceeds from sales of treasury stock................................................................................... 5,670 – 5,670
Others............................................................................................................................................ (144,062) 25,000 (119,062)
Net cash (used in) provided by financing activities............................................................. (504,004) 431,240 (72,764)
Effect of exchange rate changes on cash and cash equivalents............................................ 1,174 (520) 654
Decrease in cash and cash equivalents ....................................................................................... (11,866) (240) (12,106)
Cash and cash equivalents at beginning of the year................................................................. 272,742 6,911 279,653
Increase due to inclusion in consolidation ................................................................................... 2,297 – 2,297
Decrease due to exclusion from consolidation ........................................................................... (27) – (27)
Cash and cash equivalents at end of the year ............................................................................ ¥263,146 ¥ 6,671 ¥269,817