Nissan 2004 Annual Report Download - page 56
Download and view the complete annual report
Please find page 56 of the 2004 Nissan annual report below. You can navigate through the pages in the report by either clicking on the pages listed below, or by using the keyword search tool below to find specific information within the annual report.-
 1
1 -
2
-
3
-
4
-
5
-
6
-
7
-
8
-
9
-
10
-
11
-
12
-
13
-
14
-
15
-
16
-
17
-
18
-
19
-
20
-
21
-
22
-
23
-
24
-
25
-
26
-
27
-
28
-
29
-
30
-
31
-
32
-
33
-
34
-
35
-
36
-
37
-
38
-
39
-
40
-
41
-
42
-
43
-
44
-
45
-
 46
46 -
 47
47 -
 48
48 -
 49
49 -
 50
50 -
 51
51 -
 52
52 -
 53
53 -
 54
54 -
 55
55 -
 56
56 -
 57
57 -
 58
58 -
 59
59 -
 60
60 -
 61
61 -
 62
62 -
 63
63 -
 64
64 -
 65
65 -
 66
66 -
67
-
68
-
69
-
70
-
71
-
72
-
73
-
74
-
75
-
76
-
77
-
78
-
79
-
80
-
81
-
82
-
83
-
84
-
85
-
86
-
87
-
88
-
89
-
90
-
91
-
92
 |
 |

Nissan Annual Report 2003
54
Thousands of
Millions of yen U.S. dollars(Note 3)
2003 2002 2001 2003
For the years ended Mar. 31, 2004 Mar. 31, 2003 Mar. 31, 2002 Mar. 31, 2004
Operating activities
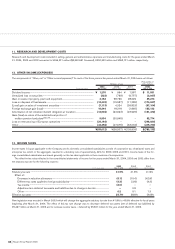
Income before income taxes and minority interests ¥736,497 ¥694,624 ¥ 364,216 $ 6,948,085
Depreciation and amortization relating to:
Leased assets 134,354 158,370 169,213 1,267,491
Other assets 326,683 212,755 205,614 3,081,915
Provision (reversal of provision) for allowance for
doubtful receivables 3,732 (503) 39,273 35,208
Unrealized loss on securities 323 769 6,757 3,047
Unrealized loss on leased vehicles 27,038 6,050 6,069 255,073
Interest and dividend income (11,591) (8,520) (13,837) (109,349)
Interest expense 63,423 80,255 102,656 598,330
Gain on sales of property, plant and equipment (4,163) (58,796) (28,229) (39,274)
Loss on disposal of property, plant and equipment 24,823 15,587 11,285 234,179
Loss (gain) on sales of securities 7,113 (4,324) 26,823 67,104
Amortization of net retirement benefit
obligation at transition 13,936 23,923 23,925 131,472
Provision for accrued retirement benefits 67,262 100,629 60,870 634,547
Retirement benefits paid (80,650) (86,917) (81,326) (760,849)
Business restructuring costs paid –(4,644) (9,213) –
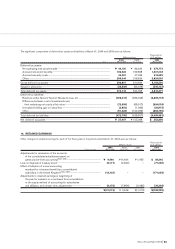
Receivables 24,539 44,989 7,334 231,500
Finance receivables (463,110) (327,357) (434,665) (4,368,962)
Inventories (28,220) (28,404) 53,162 (266,226)
Notes and accounts payable 68,879 36,877 78,255 649,802
Other 18,896 (83,947) (178,517) 178,265
Subtotal 929,764 771,416 409,665 8,771,358
Interest and dividends received 10,699 8,238 11,483 100,934
Interest paid (65,231) (80,902) (104,958) (615,387)
Income taxes paid (77,815) (123,374) (93,976) (734,103)
Net cash provided by operating activities 797,417 575,378 222,214 7,522,802
Investing activities
(Increase) decrease in short-term investments (710) 789 3,411 (6,698)
Purchases of investment securities (119,372) (32,053) (230,397) (1,126,151)
Proceeds from sales of investment securities 40,330 45,263 99,666 380,472
Long-term loans made (3,741) (11,343) (8,730) (35,292)
Collection of long-term loans receivable 4,766 13,097 6,978 44,962
Purchases of fixed assets (428,387) (377,929) (293,800) (4,041,387)
Proceeds from sales of property, plant and equipment 53,932 98,699 108,935 508,792
Purchases of leased vehicles (476,613) (483,704) (396,213) (4,496,349)
Proceeds from sales of leased vehicles 191,105 259,075 185,152 1,802,877
Proceeds from sales of subsidiaries’ stock resulting in changes
in the scope of consolidation(Note 15) 192 8,395 13,639 1,811
Additional acquisition of shares of consolidated subsidiaries (2,531) (692) (2,634) (23,877)
Other (15,097) (34,971) (10,396) (142,424)
Net cash used in investing activities (756,126) (515,374) (524,389) (7,133,264)
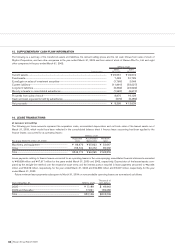
Financing activities
(Decrease) increase in short-term borrowings (137,575) (54,310) 308,869 (1,297,877)
Increase in long-term borrowings 847,393 534,053 631,451 7,994,274
Increase in bonds and debentures 150,000 85,000 246,822 1,415,094
Repayment or redemption of long-term debt (720,694) (524,115) (1,092,066) (6,799,000)
Proceeds from issuance of new shares of common stock ––220,899 –
Purchases of treasury stock (101,957) (58,383) – (961,858)
Proceeds from sales of treasury stock 9,744 5,670 2,324 91,925
Repayment of lease obligations (84,742) (9,879) (9,543) (799,453)
Cash dividends paid (74,594) (50,800) (27,841) (703,717)
Other (1,315) ––(12,407)
Net cash (used in) provided by financing activities (113,740) (72,764) 280,915 (1,073,019)
Effect of exchange rate changes on cash and cash equivalents
(2,604) 654 10,371 (24,566)
Decrease in cash and cash equivalents (75,053) (12,106) (10,889) (708,047)
Cash and cash equivalents at beginning of the year 269,817 279,653 288,536 2,545,443
Increase due to inclusion in consolidation 310 2,297 2,006 2,925
Decrease due to exclusion from consolidation (910) (27) – (8,585)
Cash and cash equivalents at end of the year ¥ 194,164 ¥269,817 ¥ 279,653 $ 1,831,736
See notes to consolidated financial statements.
CONSOLIDATED STATEMENTS OF CASH FLOWS
Nissan Motor Co., Ltd. and Consolidated Subsidiaries
Fiscal years 2003, 2002 and 2001