Nissan 2004 Annual Report Download - page 75
Download and view the complete annual report
Please find page 75 of the 2004 Nissan annual report below. You can navigate through the pages in the report by either clicking on the pages listed below, or by using the keyword search tool below to find specific information within the annual report.-
 1
1 -
2
-
3
-
4
-
5
-
6
-
7
-
8
-
9
-
10
-
11
-
12
-
13
-
14
-
15
-
16
-
17
-
18
-
19
-
20
-
21
-
22
-
23
-
24
-
25
-
26
-
27
-
28
-
29
-
30
-
31
-
32
-
33
-
34
-
35
-
36
-
37
-
38
-
39
-
40
-
41
-
42
-
43
-
44
-
45
-
46
-
47
-
48
-
49
-
50
-
51
-
52
-
53
-
54
-
55
-
56
-
57
-
58
-
59
-
60
-
61
-
62
-
63
-
64
-
 65
65 -
 66
66 -
 67
67 -
 68
68 -
 69
69 -
 70
70 -
 71
71 -
 72
72 -
 73
73 -
 74
74 -
 75
75 -
 76
76 -
 77
77 -
 78
78 -
 79
79 -
 80
80 -
 81
81 -
 82
82 -
 83
83 -
 84
84 -
 85
85 -
86
-
87
-
88
-
89
-
90
-
91
-
92
 |
 |

Nissan Annual Report 2003 73
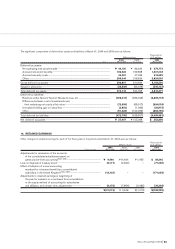
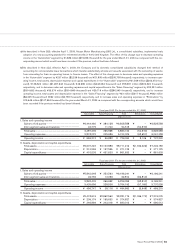
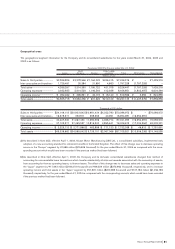
a) As described in Note 2(b), effective April 1, 2003, Nissan Motor Manufacturing (UK) Ltd., a consolidated subsidiary, implemented early
adoption of a new accounting standard for retirement benefits in the United Kingdom. The effect of this change was to decrease operating
income in the “Automobile” segment by ¥1,686 million ($15,906 thousand) for the year ended March 31, 2004 as compared with the cor-
responding amount which would have been recorded if the previous method had been followed.
b) As described in Note 2(c), effective April 1, 2003, the Company and its domestic consolidated subsidiaries changed their method of
accounting for noncancelable lease transactions which transfer substantially all risks and rewards associated with the ownership of assets,
from accounting for them as operating leases, to finance leases. The effect of this change was to decrease sales and operating expenses
in the “Automobile” segment by ¥237 million ($2,236 thousand) and ¥21,805 million ($205,708 thousand), respectively, to increase oper-
ating income, total assets, depreciation expense and capital expenditures in the “Automobile” segment by ¥21,568 million ($203,472 thou-
sand), ¥136,522 million ($1,287,943 thousand), ¥46,986 million ($443,264 thousand) and ¥55,581 million ($524,349 thousand),
respectively, and to decrease sales and operating expenses and capital expenditures in the “Sales Financing” segment by ¥33,351 million
($314,632 thousand), ¥33,374 million ($314,849 thousand) and ¥29,716 million ($280,340 thousand), respectively, and to increase
operating income, total assets and depreciation expense in the “Sales Financing” segment by ¥23 million ($217 thousand), ¥662 million
($6,245 thousand) and ¥292 million ($2,755 thousand), respectively, and to increase sales and operating expenses in “Eliminations” by
¥15,645 million ($147,594 thousand) for the year ended March 31, 2004 as compared with the corresponding amounts which would have
been recorded if the previous method had been followed.
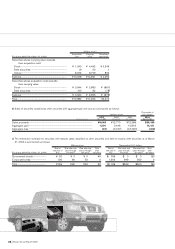
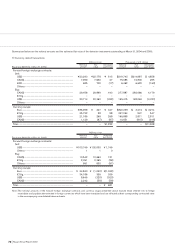
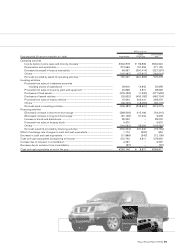
Fiscal year 2002 (For the year ended Mar. 31, 2003)
Automobile Sales Financing Total Eliminations Consolidated
Millions of yen
I. Sales and operating income
Sales to third parties ......................................................... ¥6,444,460 ¥ 384,128 ¥6,828,588 ¥ – ¥6,828,588
Inter-segment sales and transfers.................................. 42,775 11,740 54,515 (54,515) –
Total sales ............................................................................ 6,487,235 395,868 6,883,103 (54,515) 6,828,588
Operating expenses .......................................................... 5,818,023 335,986 6,154,009 (62,651) 6,091,358
Operating income .............................................................. ¥669,212 ¥ 59,882 ¥ 729,094
¥ 8,136
¥ 737,230
II. Assets, depreciation and capital expenditures
Total assets.......................................................................... ¥5,607,323 ¥3,103,889 ¥8,711,212
¥(1,362,029)
¥7,349,183
Depreciation........................................................................ ¥ 213,569 ¥ 157,556 ¥ 371,125
¥ –
¥ 371,125
Capital expenditures.......................................................... ¥410,003 ¥ 451,630 ¥ 861,633
¥ –
¥ 861,633
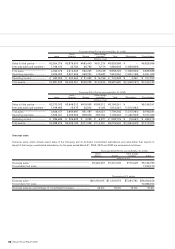
Fiscal year 2001 (For the year ended Mar. 31, 2002)
Automobile Sales Financing Total Eliminations Consolidated
Millions of yen
I. Sales and operating income
Sales to third parties ......................................................... ¥5,842,648 ¥ 353,593 ¥6,196,241 ¥ – ¥6,196,241
Inter-segment sales and transfers.................................. 49,755 13,059 62,814 (62,814) –
Total sales ............................................................................ 5,892,403 366,652 6,259,055 (62,814) 6,196,241
Operating expenses .......................................................... 5,435,656 328,536 5,764,192 (57,166) 5,707,026
Operating income .............................................................. ¥456,747 ¥ 38,116 ¥ 494,863
¥(5,648)
¥ 489,215
II. Assets, depreciation and capital expenditures
Total assets.......................................................................... ¥5,418,619 ¥2,862,560 ¥8,281,179
¥(1,066,174)
¥7,215,005
Depreciation........................................................................ ¥ 209,174 ¥ 165,653 ¥ 374,827
¥ –
¥ 374,827
Capital expenditures.......................................................... ¥ 346,994 ¥ 343,019 ¥ 690,013
¥ –
¥ 690,013