Nissan 2004 Annual Report Download - page 72
Download and view the complete annual report
Please find page 72 of the 2004 Nissan annual report below. You can navigate through the pages in the report by either clicking on the pages listed below, or by using the keyword search tool below to find specific information within the annual report.-
 1
1 -
2
-
3
-
4
-
5
-
6
-
7
-
8
-
9
-
10
-
11
-
12
-
13
-
14
-
15
-
16
-
17
-
18
-
19
-
20
-
21
-
22
-
23
-
24
-
25
-
26
-
27
-
28
-
29
-
30
-
31
-
32
-
33
-
34
-
35
-
36
-
37
-
38
-
39
-
40
-
41
-
42
-
43
-
44
-
45
-
46
-
47
-
48
-
49
-
50
-
51
-
52
-
53
-
54
-
55
-
56
-
57
-
58
-
59
-
60
-
61
-
 62
62 -
 63
63 -
 64
64 -
 65
65 -
 66
66 -
 67
67 -
 68
68 -
 69
69 -
 70
70 -
 71
71 -
 72
72 -
 73
73 -
 74
74 -
 75
75 -
 76
76 -
 77
77 -
 78
78 -
 79
79 -
 80
80 -
 81
81 -
 82
82 -
83
-
84
-
85
-
86
-
87
-
88
-
89
-
90
-
91
-
92
 |
 |

Nissan Annual Report 2003
70
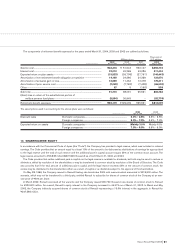
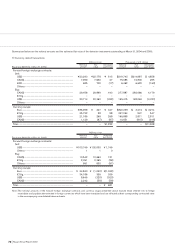
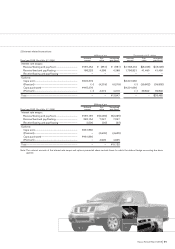
Summarized below are the notional amounts and the estimated fair value of the derivative instruments outstanding at March 31, 2004 and 2003:
1) Currency-related transactions
Millions of yen Thousands of U.S. dollars
Notional Fair Unrealized Notional Fair Unrealized
Fiscal year 2003 (As of Mar. 31, 2004) amount value gain (loss) amount value gain (loss)
Forward foreign exchange contracts:
Sell:
US
$
......................................................................................... ¥23,293 ¥22,778 ¥ 515
$219,745 $214,887 $ 4,858
CAN$ ..................................................................................... 7,959 7,932 27 75,085 74,830 255
ZAR......................................................................................... 685 702 (17) 6,462 6,622 (160)
Others..................................................................................... ––– – ––
Buy:
CAN$ ..................................................................................... 29,456 29,899 443 277,887 282,066 4,179
£ Stg....................................................................................... ––– – ––
US
$
......................................................................................... 20,714 20,362 (352) 195,415 192,094 (3,321)
Others..................................................................................... ––– – ––
Currency swaps:
Euro......................................................................................... ¥86,958 ¥ 347 ¥ 347
$820,358 $ 3,274 $ 3,274
£ Stg....................................................................................... 35,732 58 58 337,094 547 547
US
$
......................................................................................... 21,185 298 298 199,858 2,811 2,811
CAN
$
...................................................................................... 1,129 (97) (97) 10,651 (915) (915)
Total................................................................................................ ––¥1,222 – –
$11,528
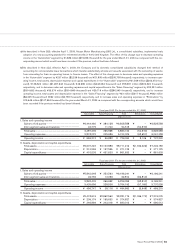
Millions of yen
Notional Fair Unrealized
Fiscal year 2002 (As of Mar. 31, 2003) amount value gain (loss)
Forward foreign exchange contracts:
Sell:
US
$
......................................................................................... ¥103,749 ¥102,000 ¥ 1,749
Others..................................................................................... 110
Buy:
CAN$ ..................................................................................... 10,542 10,663 121
£ Stg....................................................................................... 2,391 2,365 (26)
Others..................................................................................... 691 600 (91)
Currency swaps:
Euro......................................................................................... ¥34,840 ¥ (1,032) ¥(1,032)
£ Stg....................................................................................... 34,186 339 339
US
$
......................................................................................... 8,645 (320) (320)
CAN
$
...................................................................................... 2,242 (59) (59)
Total................................................................................................ ––¥681
Note: The notional amounts of the forward foreign exchange contracts and currency swaps presented above exclude those entered into to hedge
receivables and payables denominated in foreign currencies which have been translated and are reflected at their corresponding contracted rates
in the accompanying consolidated balance sheets.