Nissan 2004 Annual Report Download - page 80
Download and view the complete annual report
Please find page 80 of the 2004 Nissan annual report below. You can navigate through the pages in the report by either clicking on the pages listed below, or by using the keyword search tool below to find specific information within the annual report.-
 1
1 -
2
-
3
-
4
-
5
-
6
-
7
-
8
-
9
-
10
-
11
-
12
-
13
-
14
-
15
-
16
-
17
-
18
-
19
-
20
-
21
-
22
-
23
-
24
-
25
-
26
-
27
-
28
-
29
-
30
-
31
-
32
-
33
-
34
-
35
-
36
-
37
-
38
-
39
-
40
-
41
-
42
-
43
-
44
-
45
-
46
-
47
-
48
-
49
-
50
-
51
-
52
-
53
-
54
-
55
-
56
-
57
-
58
-
59
-
60
-
61
-
62
-
63
-
64
-
65
-
66
-
67
-
68
-
69
-
 70
70 -
 71
71 -
 72
72 -
 73
73 -
 74
74 -
 75
75 -
 76
76 -
 77
77 -
 78
78 -
 79
79 -
 80
80 -
 81
81 -
 82
82 -
 83
83 -
 84
84 -
 85
85 -
 86
86 -
 87
87 -
 88
88 -
 89
89 -
 90
90 -
91
-
92
 |
 |

Nissan Annual Report 2003
78
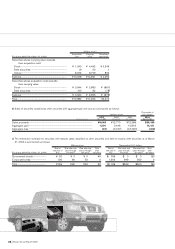
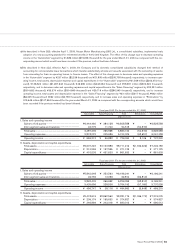
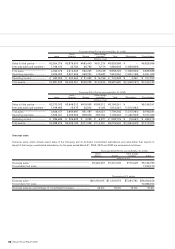
3) Summarized consolidated statements of cash flows by business segment
Millions of yen Thousands of U.S. dollars
Sales Consolidated Sales Consolidated
Fiscal year 2003 (For the year ended Mar. 31, 2004) Automobile Financing total Automobile Financing total
Operating activities
Income before income taxes and
minority interests............................................. ¥671,513 ¥ 64,984 ¥736,497
$6,335,028 $ 613,057 $ 6,948,085
Depreciation and amortization......................... 313,146 147,891 461,037 2,954,208 1,395,198 4,349,406
Increase in finance receivables......................... (154) (462,956) (463,110) (1,453) (4,367,509) (4,368,962)
Others................................................................... 57,936 5,057 62,993 546,566 47,707 594,273
Net cash provided by (used in)
operating activities.......................................... 1,042,441 (245,024) 797,417 9,834,349 (2,311,547) 7,522,802
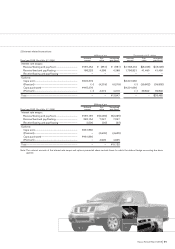
Investing activities
Proceeds from sales of investment securities
including shares of subsidiaries .................. 40,488 34 40,522 381,962 321 382,283
Proceeds from sales of property,
plant and equipment ...................................... 53,827 105 53,932 507,802 990 508,792
Purchases of fixed assets................................. (422,326) (6,061) (428,387) (3,984,208) (57,179) (4,041,387)
Purchases of leased vehicles.......................... (19,295) (457,318) (476,613) (182,028) (4,314,321) (4,496,349)
Proceeds from sales of leases vehicles........ 20,857 170,248 191,105 196,764 1,606,113 1,802,877
Others................................................................... (101,534) (35,151) (136,685) (957,867) (331,613) (1,289,480)
Net cash used in investing activities.............. (427,983) (328,143) (756,126) (4,037,575) (3,095,689) (7,133,264)
Financing activities
(Decrease) increase in short-term
borrowings ....................................................... (306,969) 169,394 (137,575) (2,895,934) 1,598,057 (1,297,877)
(Decrease) increase in long-term
borrowings ....................................................... (244,774) 371,473 126,699 (2,309,189) 3,504,463 1,195,274
Increase in bonds and debentures................. 120,000 30,000 150,000 1,132,075 283,019 1,415,094
Others................................................................... (253,031) 167 (252,864) (2,387,084) 1,574 (2,385,510)
Net cash (used in) provided by
financing activities .......................................... (684,774) 571,034 (113,740) (6,460,132) 5,387,113 (1,073,019)
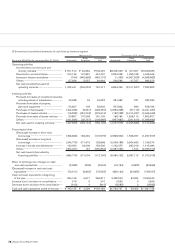
Effect of exchange rate changes on cash
and cash equivalents ........................................... (2,095) (509) (2,604)
(19,764) (4,802) (24,566)
(Decrease) increase in cash and cash
equivalents............................................................... (72,411) (2,642) (75,053)
(683,122) (24,925) (708,047)
Cash and cash equivalents at beginning
of the year................................................................ 263,146 6,671 269,817
2,482,509 62,934 2,545,443
Increase due to inclusion in consolidation .......... 310 0 310
2,925 0 2,925
Decrease due to exclusion from consolidation..... (910) 0 (910)
(8,585) 0 (8,585)
Cash and cash equivalents at end of the year...... ¥190,135 ¥ 4,029 ¥194,164 $1,793,727 $
38,009
$
1,831,736