Nissan 2004 Annual Report Download - page 48
Download and view the complete annual report
Please find page 48 of the 2004 Nissan annual report below. You can navigate through the pages in the report by either clicking on the pages listed below, or by using the keyword search tool below to find specific information within the annual report.-
 1
1 -
2
-
3
-
4
-
5
-
6
-
7
-
8
-
9
-
10
-
11
-
12
-
13
-
14
-
15
-
16
-
17
-
18
-
19
-
20
-
21
-
22
-
23
-
24
-
25
-
26
-
27
-
28
-
29
-
30
-
31
-
32
-
33
-
34
-
35
-
36
-
37
-
 38
38 -
 39
39 -
 40
40 -
 41
41 -
 42
42 -
 43
43 -
 44
44 -
 45
45 -
 46
46 -
 47
47 -
 48
48 -
 49
49 -
 50
50 -
 51
51 -
 52
52 -
 53
53 -
 54
54 -
 55
55 -
 56
56 -
 57
57 -
 58
58 -
59
-
60
-
61
-
62
-
63
-
64
-
65
-
66
-
67
-
68
-
69
-
70
-
71
-
72
-
73
-
74
-
75
-
76
-
77
-
78
-
79
-
80
-
81
-
82
-
83
-
84
-
85
-
86
-
87
-
88
-
89
-
90
-
91
-
92
 |
 |

Nissan Annual Report 2003
46
FINANCIAL REVIEW
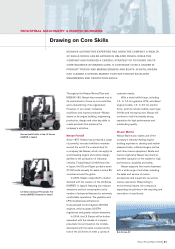
FISCAL YEAR 2003 BUSINESS
PERFORMANCE
Global sales came to 3,057,000 units,
which exceeded the forecast of 3,040,000
units. This represents an increase of
10.4% over fiscal year 2002 and the first
time in 13 years that Nissan sold more
than 3 million vehicles. Ten all-new models
launched in fiscal year 2003, together with
12 new models in 2002, contributed to
the growth.
Two major business developments
were achieved in fiscal year 2003. In the
United States, Nissan did something no
other automaker has ever tried before.
A brand-new plant in a new state, with new
employees, with five all-new products
launched on time within eight months—the
Canton, Mississippi Plant now stands as a
benchmark for auto manufacturing startup
achievement. In China, Dongfeng Motor
Co., Ltd., started operations. This
significant investment in China’s third-
largest car and truck manufacturer
will grow Nissan’s business in both the
rapidly expanding passenger car and
truck markets.
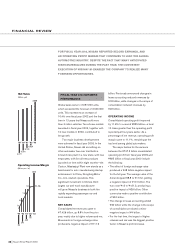
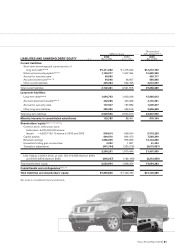
NET SALES
Consolidated net revenues came to
¥7.429 trillion, up 8.8% from the prior
year, mainly due to higher volume and mix.
Movements in foreign exchange rates
produced a negative impact of ¥111.6
billion. Previously announced changes in
lease accounting reduced revenues by
¥18 billion, while changes in the scope of
consolidation reduced revenues by
¥23 billion.
OPERATING INCOME
Consolidated operating profit improved
by 11.9% to a record ¥825 billion—a level
10 times greater than the operating profit
reported just four years earlier. As a
percentage of net revenue, operating profit
margin came to 11.1%, remaining at the
top level among global automakers.
The major factors for the variance
between the ¥737.2 billion consolidated
operating profit from fiscal year 2002 and
¥825 billion in fiscal year 2003 include
the following:
• The effect of foreign exchange rates
produced a ¥48 billion negative impact
for the full year. The average value of the
dollar dropped ¥8.8 to ¥113.2, yielding
a negative impact of ¥101 billion. The
euro rose ¥13 to ¥131.2, producing a
positive impact of ¥29 billion. Other
currencies made a positive contribution
of ¥24 billion.
• The change in lease accounting added
¥20 billion while the change in the scope
of consolidation produced a minor
negative impact of ¥4 billion.
• For the first time, the impact of higher
volumes and mix was the biggest positive
factor in Nissan’s profit increase,
FOR FISCAL YEAR 2003, NISSAN REPORTED RECORD EARNINGS, AND
AN OPERATING PROFIT MARGIN THAT CONTINUES TO LEAD THE GLOBAL
AUTOMOTIVE INDUSTRY. DESPITE THE FACT THAT MANY ANTICIPATED
RISKS MATERIALIZED DURING THE PAST YEAR, THE CONSISTENT
EXECUTION OF NISSAN 180 ENABLED THE COMPANY TO REALIZE MANY
FORESEEN OPPORTUNITIES.
5,977
6,090
6,196
6,829
7,429
’99 ’00 ’01 ’02 ’03
Net Sales
(Billion yen)
83
290
489
737
825
’99 ’00 ’01 ’02 ’03
Operating Income/Margin
(Billion yen / %)
11.1%
10.8
7.9
4.8
1.4