Nissan 2004 Annual Report Download - page 74
Download and view the complete annual report
Please find page 74 of the 2004 Nissan annual report below. You can navigate through the pages in the report by either clicking on the pages listed below, or by using the keyword search tool below to find specific information within the annual report.-
 1
1 -
2
-
3
-
4
-
5
-
6
-
7
-
8
-
9
-
10
-
11
-
12
-
13
-
14
-
15
-
16
-
17
-
18
-
19
-
20
-
21
-
22
-
23
-
24
-
25
-
26
-
27
-
28
-
29
-
30
-
31
-
32
-
33
-
34
-
35
-
36
-
37
-
38
-
39
-
40
-
41
-
42
-
43
-
44
-
45
-
46
-
47
-
48
-
49
-
50
-
51
-
52
-
53
-
54
-
55
-
56
-
57
-
58
-
59
-
60
-
61
-
62
-
63
-
 64
64 -
 65
65 -
 66
66 -
 67
67 -
 68
68 -
 69
69 -
 70
70 -
 71
71 -
 72
72 -
 73
73 -
 74
74 -
 75
75 -
 76
76 -
 77
77 -
 78
78 -
 79
79 -
 80
80 -
 81
81 -
 82
82 -
 83
83 -
 84
84 -
85
-
86
-
87
-
88
-
89
-
90
-
91
-
92
 |
 |

Nissan Annual Report 2003
72
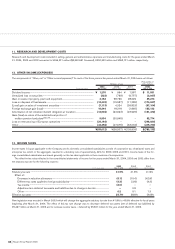
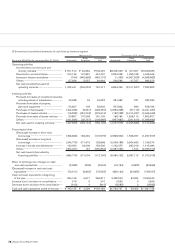
21. SEGMENT INFORMATION
The Company and its consolidated subsidiaries are primarily engaged in the manufacture and sales of products in the automobile segment
and in providing various financial services to users of the Company’s products in the sales financing segment. These products, which are sold
in Japan and overseas, principally in North America and Europe, include passenger cars, buses and trucks as well as the related components.
Financial services include primarily leases and credits principally in Japan and North America.
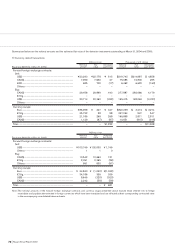
Business segments
The business segment information for the Company and its consolidated subsidiaries for the years ended March 31, 2004, 2003 and 2002 is as
follows:
Fiscal year 2003 (For the year ended Mar. 31, 2004)
Automobile Sales Financing Total Eliminations Consolidated
Millions of yen
I. Sales and operating income
Sales to third parties ......................................................... ¥7,072,982 ¥ 356,237 ¥7,429,219 ¥ – ¥7,429,219
Inter-segment sales and transfers.................................. 22,916 9,752 32,668 (32,668) –
Total sales ............................................................................ 7,095,898 365,989 7,461,887 (32,668) 7,429,219
Operating expenses .......................................................... 6,340,631 301,179 6,641,810 (37,446) 6,604,364
Operating income .............................................................. ¥755,267 ¥ 64,810 ¥ 820,077
¥4,778
¥ 824,855
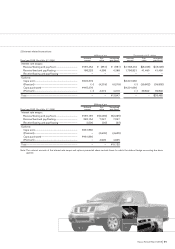
II. Assets, depreciation and capital expenditures
Total assets.......................................................................... ¥5,847,139 ¥3,479,171 ¥9,326,310
¥(1,466,454)
¥7,859,856
Depreciation........................................................................ ¥313,289 ¥ 147,748 ¥ 461,037
¥ –
¥ 461,037
Capital expenditures.......................................................... ¥441,384 ¥ 463,616 ¥ 905,000
¥ –
¥ 905,000
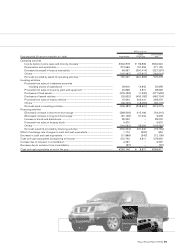
Fiscal year 2003 (For the year ended Mar. 31, 2004)
Automobile Sales Financing Total Eliminations Consolidated
Thousands of U.S. dollars
I. Sales and operating income
Sales to third parties........................................................ $66,726,245 $ 3,360,727 $70,086,972 $
–
$70,086,972
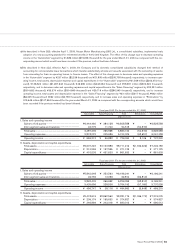
Inter-segment sales and transfers ................................ 216,189 92,000 308,189 (308,189)
–
Total sales........................................................................... 66,942,434 3,452,727 70,395,161 (308,189) 70,086,972
Operating expenses......................................................... 59,817,274 2,841,311 62,658,585 (353,264) 62,305,321
Operating income............................................................. $7,125,160 $ 611,416 $ 7,736,576 $
45,075
$7,781,651
II. Assets, depreciation and capital expenditures
Total assets ........................................................................ $55,161,689 $32,822,368 $87,984,057 $
(13,834,472)
$74,149,585
Depreciation ...................................................................... $2,955,557 $ 1,393,849 $ 4,349,406 $
–
$4,349,406
Capital expenditures ........................................................ $4,164,000 $ 4,373,736 $ 8,537,736 $
–
$8,537,736