Nissan 2004 Annual Report Download - page 64
Download and view the complete annual report
Please find page 64 of the 2004 Nissan annual report below. You can navigate through the pages in the report by either clicking on the pages listed below, or by using the keyword search tool below to find specific information within the annual report.-
 1
1 -
2
-
3
-
4
-
5
-
6
-
7
-
8
-
9
-
10
-
11
-
12
-
13
-
14
-
15
-
16
-
17
-
18
-
19
-
20
-
21
-
22
-
23
-
24
-
25
-
26
-
27
-
28
-
29
-
30
-
31
-
32
-
33
-
34
-
35
-
36
-
37
-
38
-
39
-
40
-
41
-
42
-
43
-
44
-
45
-
46
-
47
-
48
-
49
-
50
-
51
-
52
-
53
-
 54
54 -
 55
55 -
 56
56 -
 57
57 -
 58
58 -
 59
59 -
 60
60 -
 61
61 -
 62
62 -
 63
63 -
 64
64 -
 65
65 -
 66
66 -
 67
67 -
 68
68 -
 69
69 -
 70
70 -
 71
71 -
 72
72 -
 73
73 -
 74
74 -
75
-
76
-
77
-
78
-
79
-
80
-
81
-
82
-
83
-
84
-
85
-
86
-
87
-
88
-
89
-
90
-
91
-
92
 |
 |

Nissan Annual Report 2003
62
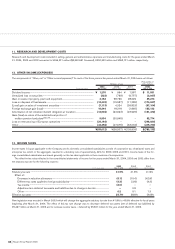
11. RESEARCH AND DEVELOPMENT COSTS
Research and development costs included in selling, general and administrative expenses and manufacturing costs for the years ended March
31, 2004, 2003 and 2002 amounted to ¥354,321 million ($3,342,651 thousand), ¥300,330 million and ¥262,121 million, respectively.
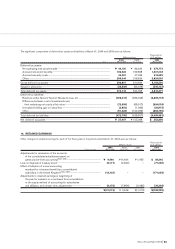
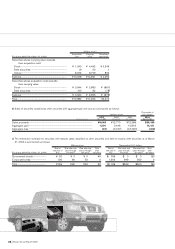
12. OTHER INCOME (EXPENSES)
The components of “Other, net” in “Other income (expenses)” for each of the three years in the period ended March 31, 2004 were as follows:
Thousands of
Millions of yen U.S. dollars
2003 2002 2001 2003
For the years ended Mar. 31, 2004 Mar. 31, 2003 Mar. 31, 2002 Mar. 31, 2004
Dividend income.............................................................................................................. ¥ 1,270 ¥954 ¥ 1,587 $ 11,981
Unrealized loss on securities........................................................................................ (323) (769) (6,757) (3,047)
Gain on sales of property, plant and equipment...................................................... 4,163 58,796 28,229 39,274
Loss on disposal of fixed assets.................................................................................. (18,449) (15,587) (11,285) (174,047)
(Loss) gain on sales of investment securities........................................................... (7,113) 4,324 (26,823) (67,104)
Foreign exchange gain (loss)........................................................................................ 16,444 18,318 (1,895) 155,132
Amortization of net retirement benefit obligation at transition .............................. (13,936) (23,923) (23,925) (131,472)
Gain (loss) on return of the substitutional portion of
welfare pension fund plans(Note 9)........................................................................... 5,594 (30,945) – 52,774
Loss on restructuring of European operations......................................................... (26,164) ––(246,830)
Other .................................................................................................................................. (44,498) (47,675) (63,034) (419,793)
................................................................................................................................. ¥(83,012) ¥(36,507) ¥(103,903) $(783,132)
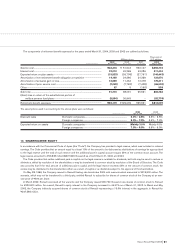
13. INCOME TAXES
Income taxes in Japan applicable to the Company and its domestic consolidated subsidiaries consist of corporation tax, inhabitants’ taxes and
enterprise tax, which, in the aggregate, resulted in a statutory rate of approximately 42% for 2003, 2002 and 2001. Income taxes of the for-
eign consolidated subsidiaries are based generally on the tax rates applicable in their countries of incorporation.
The effective tax rates reflected in the consolidated statements of income for the years ended March 31, 2004, 2003 and 2002 differ from
the statutory tax rate for the following reasons:
2003 2002 2001
For the years ended Mar. 31, 2004 Mar. 31, 2003 Mar. 31, 2002
Statutory tax rate ......................................................................................................................................... 41.9% 41.9% 41.9%
Effect of:
Decrease in valuation allowance.................................................................................................... (6.1) (10.4) (42.9)
Different tax rates applied to foreign subsidiaries...................................................................... (4.3) (3.8) (4.3)
Tax credits........................................................................................................................................... (2.0) ––
Adjustments in deferred tax assets and liabilities due to change in tax rate....................... –0.8 –
Other .................................................................................................................................................... 0.2 0.1 1.3
Effective tax rates........................................................................................................................................ 29.7% 28.6% (4.0)%
New legislation was enacted in March 2003 which will change the aggregate statutory tax rate from 41.9% to 40.6% effective for fiscal years
beginning after March 31, 2004. The effect of this tax rate change was to decrease deferred tax assets (net of deferred tax liabilities) by
¥5,467 million at March 31, 2003 and to increase income taxes – deferred by ¥5,501 million for the year ended March 31, 2003.