Nissan 2004 Annual Report Download - page 77
Download and view the complete annual report
Please find page 77 of the 2004 Nissan annual report below. You can navigate through the pages in the report by either clicking on the pages listed below, or by using the keyword search tool below to find specific information within the annual report.-
 1
1 -
2
-
3
-
4
-
5
-
6
-
7
-
8
-
9
-
10
-
11
-
12
-
13
-
14
-
15
-
16
-
17
-
18
-
19
-
20
-
21
-
22
-
23
-
24
-
25
-
26
-
27
-
28
-
29
-
30
-
31
-
32
-
33
-
34
-
35
-
36
-
37
-
38
-
39
-
40
-
41
-
42
-
43
-
44
-
45
-
46
-
47
-
48
-
49
-
50
-
51
-
52
-
53
-
54
-
55
-
56
-
57
-
58
-
59
-
60
-
61
-
62
-
63
-
64
-
65
-
66
-
 67
67 -
 68
68 -
 69
69 -
 70
70 -
 71
71 -
 72
72 -
 73
73 -
 74
74 -
 75
75 -
 76
76 -
 77
77 -
 78
78 -
 79
79 -
 80
80 -
 81
81 -
 82
82 -
 83
83 -
 84
84 -
 85
85 -
 86
86 -
 87
87 -
88
-
89
-
90
-
91
-
92
 |
 |
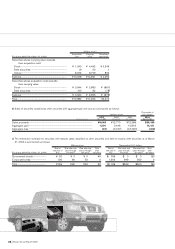
Nissan Annual Report 2003 75
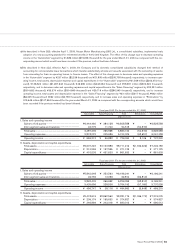
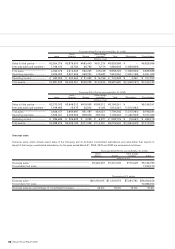
Millions of yen
Sales Consolidated
Fiscal year 2002 (As of Mar. 31, 2003) Automobile Financing total
Cash and cash equivalents.................................. ¥ 263,146 ¥ 6,671 ¥ 269,817
Short-term investments......................................... 21 15 36
Receivables, less allowance for
doubtful receivables........................................ 267,704 2,060,679 2,328,383
Inventories................................................................ 526,062 17,546 543,608
Other current assets.............................................. 397,157 161,056 558,213
Total current assets ............................................... 1,454,090 2,245,967 3,700,057
Property, plant and equipment, net .................... 2,223,124 766,210 2,989,334
Investment securities............................................. 256,515 10,531 267,046
Other assets ............................................................ 311,542 81,204 392,746
Total assets.............................................................. ¥4,245,271 ¥3,103,912 ¥7,349,183
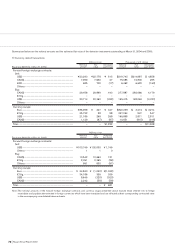
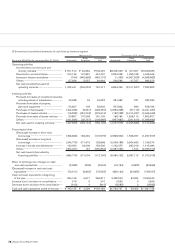
Short-term borrowings and current
portion of long-term debt ............................. ¥ (653,588) ¥1,968,810 ¥1,315,222
Notes and accounts payable............................... 1,015,967 31,397 1,047,364
Accrued income taxes........................................... 36,907 – 36,907
Other current liabilities.......................................... 432,629 89,696 522,325
Total current liabilities............................................ 831,915 2,089,903 2,921,818
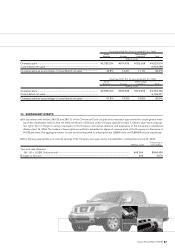
Long-term debt ....................................................... 1,024,686 578,560 1,603,246
Other long-term liabilities ..................................... 772,081 155,283 927,364
Total long-term liabilities....................................... 1,796,767 733,843 2,530,610
Total liabilities.......................................................... 2,628,682 2,823,746 5,452,428
Minority interests .................................................... 88,451 – 88,451
Common stock........................................................ 523,707 82,107 605,814
Capital surplus ........................................................ 774,403 30,067 804,470
Retained earnings .................................................. 730,373 148,282 878,655
Unrealized holding gain on securities................ 1,934 (103) 1,831
Translation adjustments ........................................ (340,089) 19,813 (320,276)
Treasury stock......................................................... (162,190) – (162,190)
Total shareholders’ equity..................................... 1,528,138 280,166 1,808,304
Total liabilities and shareholders’ equity ........... ¥4,245,271 ¥3,103,912 ¥7,349,183