Nissan 2004 Annual Report Download - page 50
Download and view the complete annual report
Please find page 50 of the 2004 Nissan annual report below. You can navigate through the pages in the report by either clicking on the pages listed below, or by using the keyword search tool below to find specific information within the annual report.-
 1
1 -
2
-
3
-
4
-
5
-
6
-
7
-
8
-
9
-
10
-
11
-
12
-
13
-
14
-
15
-
16
-
17
-
18
-
19
-
20
-
21
-
22
-
23
-
24
-
25
-
26
-
27
-
28
-
29
-
30
-
31
-
32
-
33
-
34
-
35
-
36
-
37
-
38
-
39
-
 40
40 -
 41
41 -
 42
42 -
 43
43 -
 44
44 -
 45
45 -
 46
46 -
 47
47 -
 48
48 -
 49
49 -
 50
50 -
 51
51 -
 52
52 -
 53
53 -
 54
54 -
 55
55 -
 56
56 -
 57
57 -
 58
58 -
 59
59 -
 60
60 -
61
-
62
-
63
-
64
-
65
-
66
-
67
-
68
-
69
-
70
-
71
-
72
-
73
-
74
-
75
-
76
-
77
-
78
-
79
-
80
-
81
-
82
-
83
-
84
-
85
-
86
-
87
-
88
-
89
-
90
-
91
-
92
 |
 |
Nissan Annual Report 2003
48
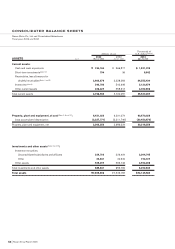
Capital expenditures increased to
¥427.3 billion, representing 5.8% of net
revenue. Depreciation was ¥213.9 billion.
Investment security increased by ¥933.3
billion, including the investment in
Dongfeng Motor Co., Ltd.
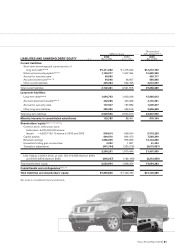
SHAREHOLDERS’ EQUITY
Total shareholder equity increased from
¥1.8083 trillion to ¥2.024 trillion in fiscal
year 2002, due to higher profitability.
Consolidated shareholder equity
strengthened during the fiscal year,
representing 27% of total revenues and
26% of total assets.
DIVIDEND
At the shareholder meeting on June 23,
2004, the company proposed increasing
its dividend to ¥19 per share in 2003, from
¥14 in 2002. Nissan’s three-year dividend
plan is to increase dividend per share to
¥24 in 2004. By the end of Nissan’s next
three-year business plan NISSAN Value-
up in March 2008, Nissan plants to pay
an annual dividend of no less than ¥40 per
share, more than double the ¥19 per
share level that was approved for fiscal
year 2003.
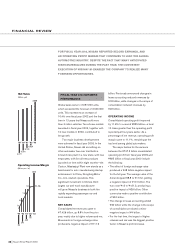
INVESTMENT POLICY
Capital expenditures increased ¥49
billion to ¥427 billion, representing
5.8% of net revenue. This is the third year
in a row with a double-digit increase in
capital expenditures.
R&D expenditures increased by ¥54
billion to ¥354.3 billion. The increase went
to fund new technologies and product
development, including increased
expenses for hybrid and fuel cell vehicles.
DEBT
The objective of eliminating net automotive
debt was achieved at the end of fiscal year
2002—two years before the end of the
NISSAN 180 plan—at constant accounting
standards. After returning the off-balance
sheet investment in the new Canton Plant
and liabilities for financial leases, net
automotive debt dropped from ¥268.3
billion to ¥13.6 billion.
Despite higher expenditures for capital
expenditures and R&D to prepare for the
future and significant financial investments
in its China operations, among others,
Nissan eliminated more than ¥250 billion
in automotive debt.
Nissan has been upgraded by rating
agencies and is now in the investment
grade category.
CASH FLOW
Consolidated cash generated from
operating activities accounted to ¥797.4
billion during fiscal year 2003. The higher
profits from operations and improved
working capital requirements contributed
to the cash flow. This cash was mainly
used for investments for future growth.
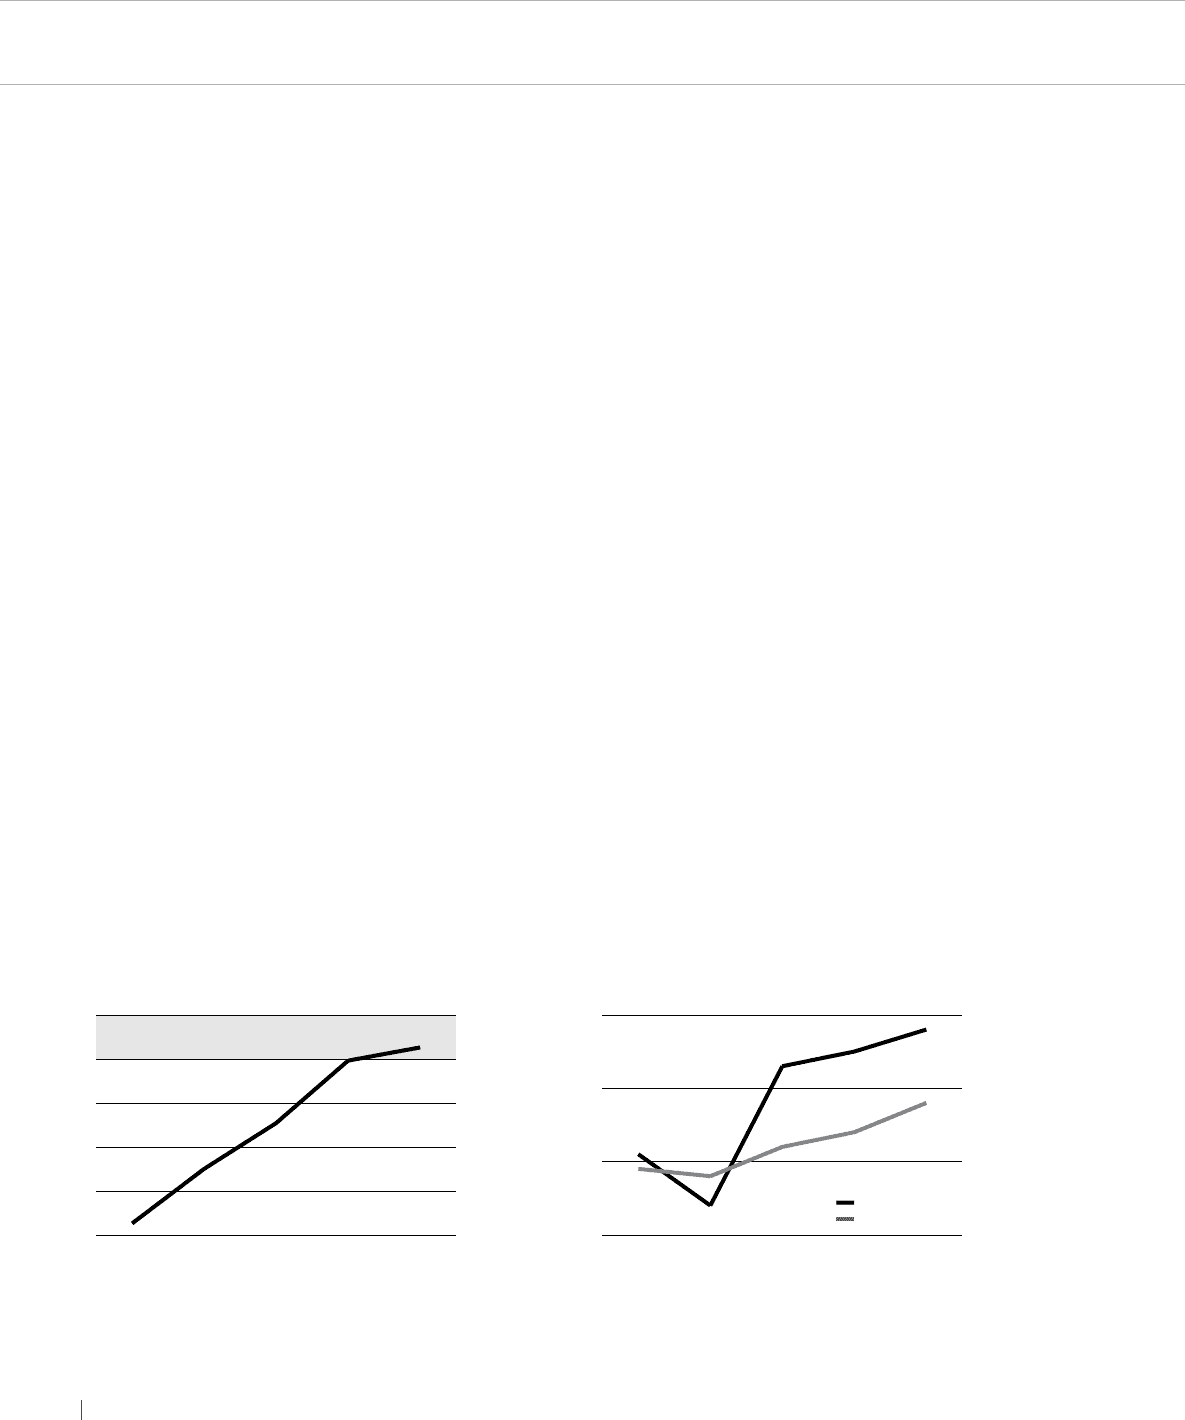
RETURN ON INVESTED CAPITAL
(ROIC)
Nissan’s investments are made within the
strict guidelines of its automotive operating
return on invested capital (ROIC). Based
on its ROIC guidelines, Nissan exceeded a
20% return on invested capital, reaching a
record 21.3% for fiscal year 2003.
The ratio of working capital to net
revenue has improved, dropping to 3.6%
from 5.8% in 2002, through tighter control
of accounts payable, receivables
and inventory.
21.3%
19.8%
Target: 20%
12.7%
7.5%
1.3%
’99 ’00 ’01 ’02 ’03
Return on Invested Capital (Auto)
Fiscal years 1999-2003 (% to net sales)
25
20
15
10
5
0
Investment in our Future
Fiscal years 1999-2003 (% of net revenue)
Capital expenditure
R&D
5.8%
+49 billion yen
+54 billion yen
5.5%
5.3%
3.4%
4.1%
’99 ’00 ’01 ’02 ’03
6
5
4
3
Canton Plant investment included from fiscal year 2001
3.9%
3.8%
4.2%
4.4%
4.8%