Nissan 2004 Annual Report Download - page 79
Download and view the complete annual report
Please find page 79 of the 2004 Nissan annual report below. You can navigate through the pages in the report by either clicking on the pages listed below, or by using the keyword search tool below to find specific information within the annual report.-
 1
1 -
2
-
3
-
4
-
5
-
6
-
7
-
8
-
9
-
10
-
11
-
12
-
13
-
14
-
15
-
16
-
17
-
18
-
19
-
20
-
21
-
22
-
23
-
24
-
25
-
26
-
27
-
28
-
29
-
30
-
31
-
32
-
33
-
34
-
35
-
36
-
37
-
38
-
39
-
40
-
41
-
42
-
43
-
44
-
45
-
46
-
47
-
48
-
49
-
50
-
51
-
52
-
53
-
54
-
55
-
56
-
57
-
58
-
59
-
60
-
61
-
62
-
63
-
64
-
65
-
66
-
67
-
68
-
 69
69 -
 70
70 -
 71
71 -
 72
72 -
 73
73 -
 74
74 -
 75
75 -
 76
76 -
 77
77 -
 78
78 -
 79
79 -
 80
80 -
 81
81 -
 82
82 -
 83
83 -
 84
84 -
 85
85 -
 86
86 -
 87
87 -
 88
88 -
 89
89 -
90
-
91
-
92
 |
 |

Nissan Annual Report 2003 77
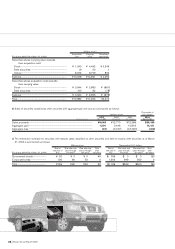
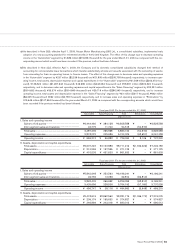
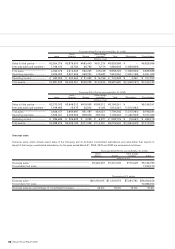
2) Summarized consolidated statements of income by business segment
Millions of yen Thousands of U.S. dollars
Sales Consolidated Sales Consolidated
Fiscal year 2003 (For the year ended Mar. 31, 2004) Automobile Financing total Automobile Financing total
Net sales...................................................................... ¥7,063,230 ¥365,989 ¥7,429,219
$
66,634,245
$
3,452,727
$70,086,972
Cost of sales .............................................................. 5,098,056 212,116 5,310,172 48,094,868 2,001,094 50,095,962
Gross profit................................................................. 1,965,174 153,873 2,119,047 18,539,377 1,451,633 19,991,010
Operating income...................................................... 760,045 64,810 824,855 7,170,236 611,415 7,781,651
Operating income as a percentage of net sales
.....
10.8% 17.7% 11.1% 10.8% 17.7% 11.1%
Net financial cost....................................................... (15,669) (30) (15,699) (147,821) (283) (148,104)
Income before income taxes and
minority interests ............................................... 671,513 64,984 736,497 6,335,028 613,057 6,948,085
Net income.................................................................. ¥ 465,329 ¥ 38,338 ¥ 503,667 $ 4,389,896 $ 361,679 $ 4,751,575
Total net financial cost ............................................. ¥ (15,669) ¥ (30) ¥ (15,699) $ (147,821) $ (283) $ (148,104)
Interest on lease obligation....................................... (4,603) (20) (4,623) (43,424) (189) (43,613)
Intersegment elimination ............................................ (5,322) – (5,322) (50,208) – (50,208)
Net financial cost for segment................................ (5,744) (10) (5,754) (54,189) (94) (54,283)
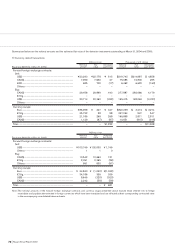
Millions of yen
Sales Consolidated
Fiscal year 2002 (For the year ended Mar. 31, 2003) Automobile Financing total
Net sales...................................................................... ¥6,432,720 ¥395,868 ¥6,828,588
Cost of sales .............................................................. 4,617,368 254,956 4,872,324
Gross profit................................................................. 1,815,352 140,912 1,956,264
Operating income...................................................... 677,348 59,882 737,230
Operating income as a percentage of net sales
..... 10.5% 15.1% 10.8%
Net financial cost....................................................... (16,543) 3 (16,540)
Income before income taxes and
minority interests ............................................... 634,818 59,806 694,624
Net income.................................................................. ¥ 458,611 ¥ 36,554 ¥ 495,165
Total net financial cost ............................................. ¥ (16,543) ¥ 3 ¥ (16,540)
Intersegment elimination ............................................ (5,677) – (5,677)
Net financial cost for segment................................ (10,866) 3 (10,863)
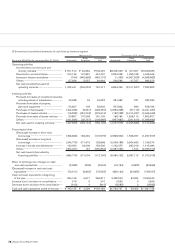
Millions of yen
Sales Consolidated
Fiscal year 2001 (For the year ended Mar. 31, 2002) Automobile Financing total
Net sales...................................................................... ¥5,829,589 ¥366,652 ¥6,196,241
Cost of sales .............................................................. 4,294,565 251,961 4,546,526
Gross profit................................................................. 1,535,024 114,691 1,649,715
Operating income...................................................... 451,099 38,116 489,215
Operating income as a percentage of net sales
..... 7.7% 10.4% 7.9%
Net financial cost....................................................... (20,428) (2) (20,430)
Income before income taxes and
minority interests ............................................... 327,197 37,019 364,216
Net income.................................................................. ¥ 349,890 ¥ 22,372 ¥ 372,262
Total net financial cost ............................................. ¥ (20,428) ¥ (2) ¥ (20,430)
Intersegment elimination ............................................ (5,469) – (5,469)
Net financial cost for segment................................ (14,959) (2) (14,961)