Neiman Marcus 2006 Annual Report Download - page 39
Download and view the complete annual report
Please find page 39 of the 2006 Neiman Marcus annual report below. You can navigate through the pages in the report by either clicking on the pages listed below, or by using the keyword search tool below to find specific information within the annual report.-
 1
1 -
2
-
3
-
4
-
5
-
6
-
7
-
8
-
9
-
10
-
11
-
12
-
13
-
14
-
15
-
16
-
17
-
18
-
19
-
20
-
21
-
22
-
23
-
24
-
25
-
26
-
27
-
28
-
 29
29 -
 30
30 -
 31
31 -
 32
32 -
 33
33 -
 34
34 -
 35
35 -
 36
36 -
 37
37 -
 38
38 -
 39
39 -
 40
40 -
 41
41 -
 42
42 -
 43
43 -
 44
44 -
 45
45 -
 46
46 -
 47
47 -
 48
48 -
 49
49 -
50
-
51
-
52
-
53
-
54
-
55
-
56
-
57
-
58
-
59
-
60
-
61
-
62
-
63
-
64
-
65
-
66
-
67
-
68
-
69
-
70
-
71
-
72
-
73
-
74
-
75
-
76
-
77
-
78
-
79
-
80
-
81
-
82
-
83
-
84
-
85
-
86
-
87
-
88
-
89
-
90
-
91
-
92
-
93
-
94
-
95
-
96
-
97
-
98
-
99
-
100
-
101
-
102
-
103
-
104
-
105
-
106
-
107
-
108
-
109
-
110
-
111
-
112
-
113
-
114
-
115
-
116
-
117
-
118
-
119
-
120
-
121
-
122
-
123
-
124
-
125
-
126
-
127
-
128
-
129
-
130
-
131
-
132
-
133
-
134
-
135
-
136
-
137
-
138
-
139
-
140
-
141
-
142
-
143
-
144
-
145
-
146
-
147
-
148
-
149
-
150
-
151
-
152
-
153
-
154
-
155
-
156
-
157
-
158
-
159
-
160
-
161
-
162
-
163
-
164
-
165
-
166
-
167
-
168
-
169
-
170
-
171
 |
 |

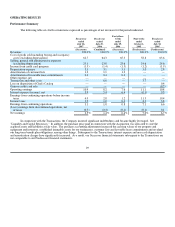
Operating earnings for our Specialty Retail stores segment were $403.7 million, or 12.0% of Specialty Retail stores revenues, for
fiscal year 2006 compared to $377.8 million, or 12.2% of Specialty Retail stores revenues, for the prior year period. Operating margin for
Specialty Retail stores was positively impacted by 1) higher product margins, 2) lower SG&A expenses for compensation and related
benefits, as a percentage of revenues, as a result of leveraging these expenses on a higher level of revenues in fiscal year 2006 and 3) the
leveraging of buying and occupancy costs on a higher level of revenues. These effects were offset, in part, by 1) a lower level of income
from our credit card operations due to the sale of our credit card operations to HSBC in July 2005, 2) higher preopening costs and
3) higher depreciation charges as a result of higher levels of capital expenditures for new stores and store remodels in recent years.
Operating earnings for Direct Marketing increased to $98.2 million, or 15.0% of Direct Marketing revenues, in fiscal year 2006
from $75.2 million, or 12.7% of Direct Marketing revenues, for the prior year period. The increase in operating earnings and operating
margin for Direct Marketing was primarily the result of 1) higher product margins and 2) the decrease in advertising and marketing costs,
as a percentage of revenues, incurred to support internet sales.
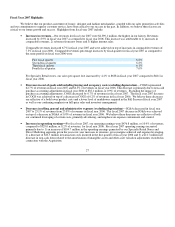
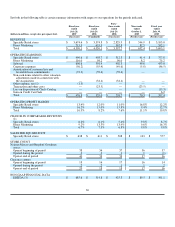
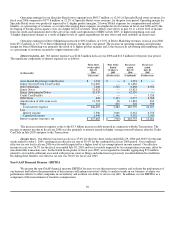
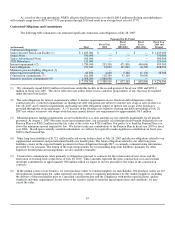
Interest expense, net. Net interest expense was $216.8 million in fiscal year 2006 and $12.3 million for the prior year period.
The significant components of interest expense are as follows:
(in thousands)
Forty-three
weeks ended
July 29,
2006
Nine weeks
Ended
October 1,
2005
Fiscal year
ended
July 29,
2006
Fiscal year
ended
July 30,
2005
(Successor) (Predecessor) (Combined) (Predecessor)
Asset-Based Revolving Credit Facility $ 1,332 $ — $ 1,332 $ —
Senior Secured Term Loan Facility 111,662 — 111,662 —
2028 Debentures 7,266 1,542 8,808 8,904
Senior Notes 51,421 — 51,421 —
Senior Subordinated Notes 42,339 — 42,339 —
Credit Card Facility — — — 5,526
2008 Notes 638 1,439 2,077 8,308
Amortization of debt issue costs 11,728 96 11,824 831
Other 111 205 316 598
Total interest expense 226,497 3,282 229,779 24,167
Less:
Interest income 5,386 3,046 8,432 6,556
Capitalized interest 3,446 1,146 4,592 5,350
Interest expense (income), net $ 217,665 $ (910)$ 216,755 $ 12,261
The increase in interest expense is due to the $3.3 billion increase in debt incurred in connection with the Transactions. The
increase in interest income in fiscal year 2006 was due primarily to interest earned on higher average invested balances after the Credit
Card Sale in July 2005 and prior to the Transactions.
Income taxes. Our effective income tax rate was 35.6% for the forty-three weeks ended July 29, 2006 and 36.8% for the nine
weeks ended October 1, 2005, resulting in an effective tax rate of 36.4% for the combined fiscal year 2006 period. Our combined
effective tax rate for fiscal year 2006 was favorably impacted by a higher level of tax-exempt interest income earned. Our effective
income tax rate was 36.7% for the fiscal year ended July 30, 2005 and was favorably impacted by tax-exempt interest income, offset by
non-deductible transaction costs. In the fourth fiscal quarter of fiscal year 2005, we recognized tax benefits aggregating $7.6 million
related to a favorable settlement associated with previous state tax filings and reductions in previously recorded deferred tax liabilities.
Excluding these benefits, our effective tax rate was 38.6% for fiscal year 2005.
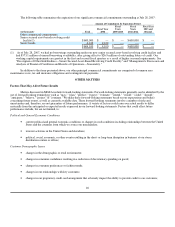
Non-GAAP Financial Measure - EBITDA
We present the non-GAAP financial measure EBITDA because we use this measure to monitor and evaluate the performance of
our business and believe the presentation of this measure will enhance investors' ability to analyze trends in our business, evaluate our
performance relative to other companies in our industry and evaluate our ability to service our debt. In addition, we use EBITDA as a
component of the measurement of incentive compensation.
36