Neiman Marcus 2006 Annual Report Download - page 155
Download and view the complete annual report
Please find page 155 of the 2006 Neiman Marcus annual report below. You can navigate through the pages in the report by either clicking on the pages listed below, or by using the keyword search tool below to find specific information within the annual report.-
 1
1 -
2
-
3
-
4
-
5
-
6
-
7
-
8
-
9
-
10
-
11
-
12
-
13
-
14
-
15
-
16
-
17
-
18
-
19
-
20
-
21
-
22
-
23
-
24
-
25
-
26
-
27
-
28
-
29
-
30
-
31
-
32
-
33
-
34
-
35
-
36
-
37
-
38
-
39
-
40
-
41
-
42
-
43
-
44
-
45
-
46
-
47
-
48
-
49
-
50
-
51
-
52
-
53
-
54
-
55
-
56
-
57
-
58
-
59
-
60
-
61
-
62
-
63
-
64
-
65
-
66
-
67
-
68
-
69
-
70
-
71
-
72
-
73
-
74
-
75
-
76
-
77
-
78
-
79
-
80
-
81
-
82
-
83
-
84
-
85
-
86
-
87
-
88
-
89
-
90
-
91
-
92
-
93
-
94
-
95
-
96
-
97
-
98
-
99
-
100
-
101
-
102
-
103
-
104
-
105
-
106
-
107
-
108
-
109
-
110
-
111
-
112
-
113
-
114
-
115
-
116
-
117
-
118
-
119
-
120
-
121
-
122
-
123
-
124
-
125
-
126
-
127
-
128
-
129
-
130
-
131
-
132
-
133
-
134
-
135
-
136
-
137
-
138
-
139
-
140
-
141
-
142
-
143
-
144
-
 145
145 -
 146
146 -
 147
147 -
 148
148 -
 149
149 -
 150
150 -
 151
151 -
 152
152 -
 153
153 -
 154
154 -
 155
155 -
 156
156 -
 157
157 -
 158
158 -
 159
159 -
 160
160 -
 161
161 -
 162
162 -
 163
163 -
 164
164 -
 165
165 -
166
-
167
-
168
-
169
-
170
-
171
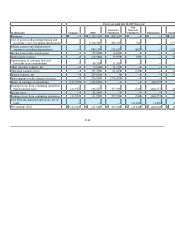
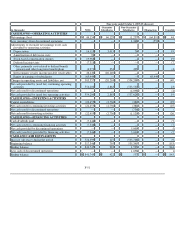
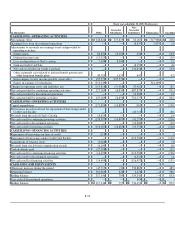
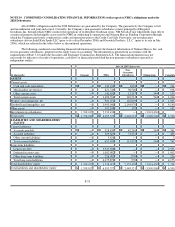
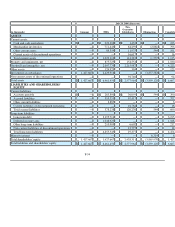
 |
 |
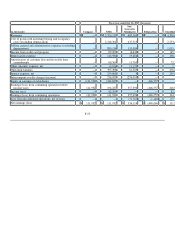
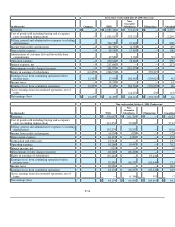
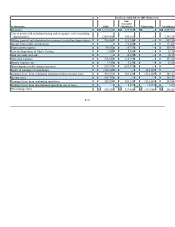
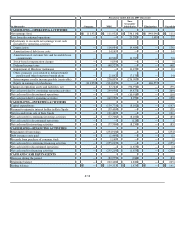
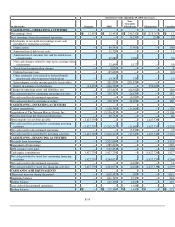
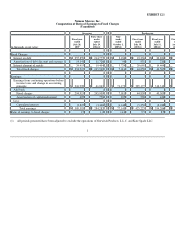
Fiscal year ended July 28, 2007 (Successor)
(in thousands) Company NMG
Non-
Guarantor
Subsidiaries Eliminations Consolidated
Revenues $ — $ 3,700,513 $ 689,563 $ — $ 4,390,076
Cost of goods sold including buying and occupancy
costs (excluding depreciation) — 2,316,301 437,513 — 2,753,814
Selling, general and administrative expenses (excluding
depreciation) — 880,136 135,004 — 1,015,140
Income from credit card program — (59,090 ) (6,633 ) — (65,723
Depreciation expense — 116,984 19,484 — 136,468
Amortization of customer lists and favorable lease
commitments — 60,500 11,765 — 72,265
Other (income) expense, net — (9,816 )11,125 — 1,309
Operating earnings — 395,498 81,305 — 476,803
Interest expense, net — 259,801 4 — 259,805
Intercompany royalty charges (income) — 276,095 (276,095 ) —
Equity in earnings of subsidiaries (111,932 )(334,625 )— 446,557
Earnings (loss) from continuing operations before
income taxes 111,932 194,227 357,396 (446,557 ) 216,998
Income taxes — 82,295 — — 82,295
Earnings (loss) from continuing operations 111,932 111,932 357,396 (446,557 ) 134,703
Loss from discontinued operations, net of taxes — — (21,282 )(1,489 )(22,771
Net earnings (loss) $ 111,932 $ 111,932 $ 336,114 $ (448,046 )$ 111,932
F-55