Neiman Marcus 2006 Annual Report Download - page 141
Download and view the complete annual report
Please find page 141 of the 2006 Neiman Marcus annual report below. You can navigate through the pages in the report by either clicking on the pages listed below, or by using the keyword search tool below to find specific information within the annual report.-
 1
1 -
2
-
3
-
4
-
5
-
6
-
7
-
8
-
9
-
10
-
11
-
12
-
13
-
14
-
15
-
16
-
17
-
18
-
19
-
20
-
21
-
22
-
23
-
24
-
25
-
26
-
27
-
28
-
29
-
30
-
31
-
32
-
33
-
34
-
35
-
36
-
37
-
38
-
39
-
40
-
41
-
42
-
43
-
44
-
45
-
46
-
47
-
48
-
49
-
50
-
51
-
52
-
53
-
54
-
55
-
56
-
57
-
58
-
59
-
60
-
61
-
62
-
63
-
64
-
65
-
66
-
67
-
68
-
69
-
70
-
71
-
72
-
73
-
74
-
75
-
76
-
77
-
78
-
79
-
80
-
81
-
82
-
83
-
84
-
85
-
86
-
87
-
88
-
89
-
90
-
91
-
92
-
93
-
94
-
95
-
96
-
97
-
98
-
99
-
100
-
101
-
102
-
103
-
104
-
105
-
106
-
107
-
108
-
109
-
110
-
111
-
112
-
113
-
114
-
115
-
116
-
117
-
118
-
119
-
120
-
121
-
122
-
123
-
124
-
125
-
126
-
127
-
128
-
129
-
130
-
 131
131 -
 132
132 -
 133
133 -
 134
134 -
 135
135 -
 136
136 -
 137
137 -
 138
138 -
 139
139 -
 140
140 -
 141
141 -
 142
142 -
 143
143 -
 144
144 -
 145
145 -
 146
146 -
 147
147 -
 148
148 -
 149
149 -
 150
150 -
 151
151 -
152
-
153
-
154
-
155
-
156
-
157
-
158
-
159
-
160
-
161
-
162
-
163
-
164
-
165
-
166
-
167
-
168
-
169
-
170
-
171
 |
 |

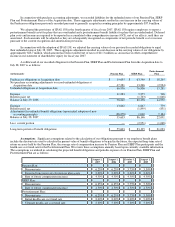
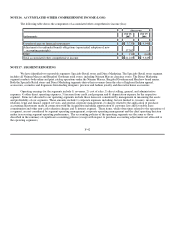
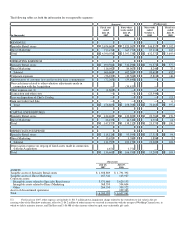
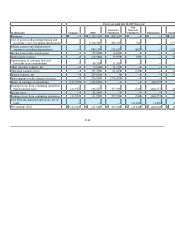
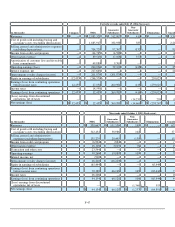
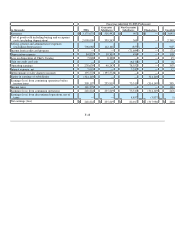
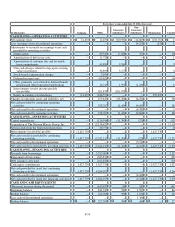
The following tables set forth the information for our reportable segments:
(Successor) (Predecessor)
(in thousands)
Fiscal year
ended
July 28,
2007
Forty-three
weeks ended
July 29,
2006
Nine weeks
ended
October 1,
2005
Fiscal year
ended
July 30,
2005
REVENUES
Specialty Retail stores $ 3,674,600 $ 2,829,967 $ 544,857 $ 3,102,952
Direct Marketing 715,476 567,771 87,515 592,122
Total $ 4,390,076 $ 3,397,738 $ 632,372 $ 3,695,074
OPERATING EARNINGS
Specialty Retail stores $ 490,564 $ 312,296 $ 91,372 $ 377,772
Direct Marketing 116,042 89,967 8,246 75,178
Subtotal 606,606 402,263 99,618 452,950
Corporate expenses (56,229 ) (49,504 ) (5,811 ) (46,334
Amortization of customer lists and favorable lease commitments (72,265 ) (59,640 ) — —
Non-cash items related to other valuation adjustments made in
connection with the Acquisition — (34,411 ) — —
Other expense, net (1) (1,309 ) — — —
Transaction and other costs — — (23,544 ) —
Loss on disposition of Chef's Catalog — — — (15,348
Gain on Credit Card Sale — — — 6,170
Total $ 476,803 $ 258,708 $ 70,263 $ 397,438
CAPITAL EXPENDITURES
Specialty Retail stores $ 124,402 $ 123,693 $ 22,784 $ 176,519
Direct Marketing 23,475 14,519 2,791 13,736
Total $ 147,877 $ 138,212 $ 25,575 $ 190,255
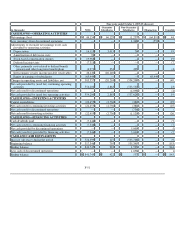
DEPRECIATION EXPENSE
Specialty Retail stores $ 118,126 $ 93,599 $ 17,313 $ 94,386
Direct Marketing 13,671 9,580 1,896 9,203
Subtotal 131,797 103,179 19,209 103,589
Depreciation expense on step-up of fixed assets made in connection
with the Acquisition 4,671 3,771 — —
Total $ 136,468 $ 106,950 $ 19,209 $ 103,589
(Successor)
July 28,
2007
July 29,
2006
ASSETS
Tangible assets of Specialty Retail stores $ 1,928,889 $ 1,791,392
Tangible assets of Direct Marketing 167,541 143,927
Corporate assets:
Intangible assets related to Specialty Retail stores 3,571,660 3,629,153
Intangible assets related to Direct Marketing 568,359 594,604
Other 264,550 339,522
Assets of discontinued operations — 109,363
Total $ 6,500,999 $ 6,607,961
(1) For fiscal year 2007, other expense, net includes 1) $11.5 million pretax impairment charge related to the writedown to fair value in the net
carrying value of the Horchow tradename, offset by 2) $4.2 million of other income we received in connection with the merger of Wedding Channel.com, in
which we held a minority interest, and The Knot and 3) $6.0M of other income related to aged, non-escheatable gift cards.