Neiman Marcus 2006 Annual Report Download - page 103
Download and view the complete annual report
Please find page 103 of the 2006 Neiman Marcus annual report below. You can navigate through the pages in the report by either clicking on the pages listed below, or by using the keyword search tool below to find specific information within the annual report.-
 1
1 -
2
-
3
-
4
-
5
-
6
-
7
-
8
-
9
-
10
-
11
-
12
-
13
-
14
-
15
-
16
-
17
-
18
-
19
-
20
-
21
-
22
-
23
-
24
-
25
-
26
-
27
-
28
-
29
-
30
-
31
-
32
-
33
-
34
-
35
-
36
-
37
-
38
-
39
-
40
-
41
-
42
-
43
-
44
-
45
-
46
-
47
-
48
-
49
-
50
-
51
-
52
-
53
-
54
-
55
-
56
-
57
-
58
-
59
-
60
-
61
-
62
-
63
-
64
-
65
-
66
-
67
-
68
-
69
-
70
-
71
-
72
-
73
-
74
-
75
-
76
-
77
-
78
-
79
-
80
-
81
-
82
-
83
-
84
-
85
-
86
-
87
-
88
-
89
-
90
-
91
-
92
-
 93
93 -
 94
94 -
 95
95 -
 96
96 -
 97
97 -
 98
98 -
 99
99 -
 100
100 -
 101
101 -
 102
102 -
 103
103 -
 104
104 -
 105
105 -
 106
106 -
 107
107 -
 108
108 -
 109
109 -
 110
110 -
 111
111 -
 112
112 -
 113
113 -
114
-
115
-
116
-
117
-
118
-
119
-
120
-
121
-
122
-
123
-
124
-
125
-
126
-
127
-
128
-
129
-
130
-
131
-
132
-
133
-
134
-
135
-
136
-
137
-
138
-
139
-
140
-
141
-
142
-
143
-
144
-
145
-
146
-
147
-
148
-
149
-
150
-
151
-
152
-
153
-
154
-
155
-
156
-
157
-
158
-
159
-
160
-
161
-
162
-
163
-
164
-
165
-
166
-
167
-
168
-
169
-
170
-
171
 |
 |
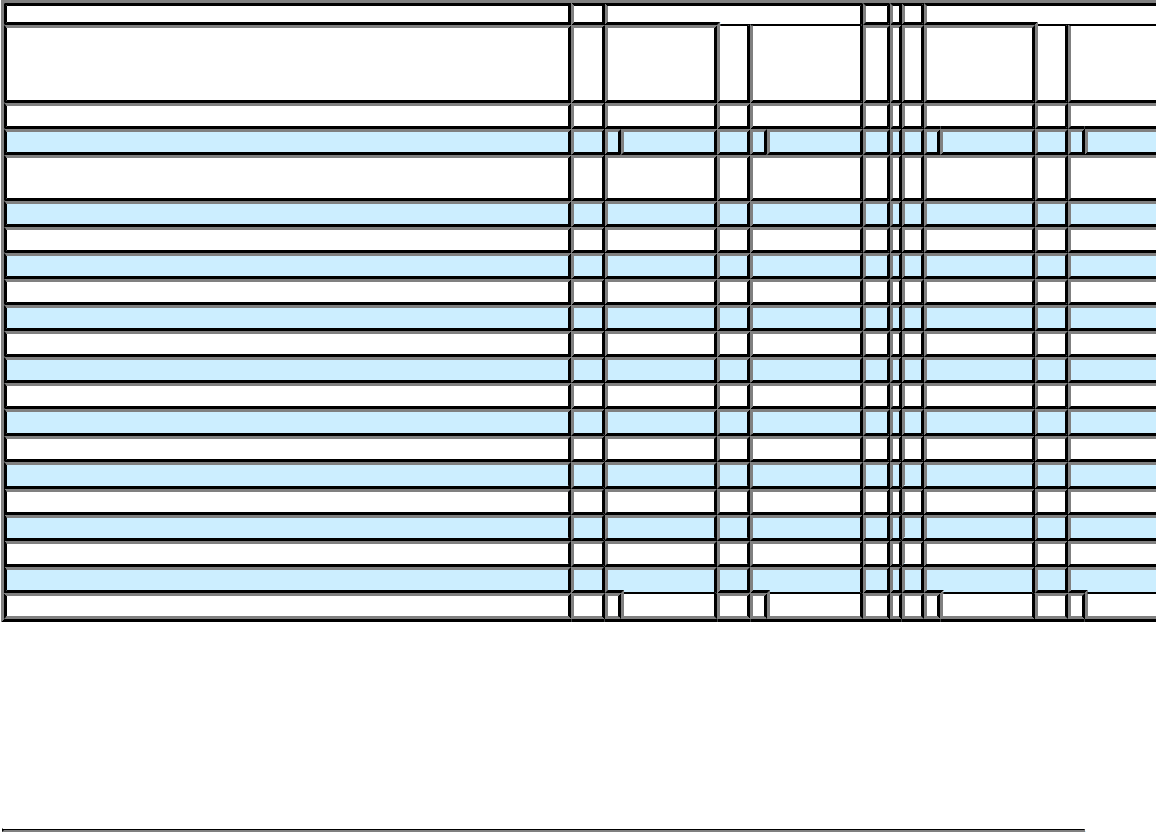
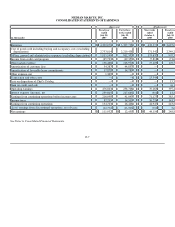
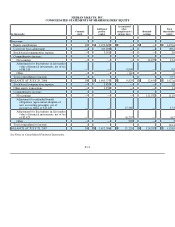
NEIMAN MARCUS, INC.
CONSOLIDATED STATEMENTS OF EARNINGS
(Successor) (Predecessor)
(in thousands)
Fiscal year
ended
July 28,
2007
Forty-three
weeks ended
July 29,
2006
Nine weeks
ended
October 1,
2005
Fiscal year
ended
July 30,
2005
Revenues $ 4,390,076 $ 3,397,738 $ 632,372 $ 3,695,074
Cost of goods sold including buying and occupancy costs (excluding
depreciation) 2,753,814 2,219,438 371,542 2,349,207
Selling, general and administrative expenses (excluding depreciation) 1,015,140 802,355 155,632 907,306
Income from credit card program (65,723 ) (49,353 ) (7,818 ) (71,644
Depreciation expense 136,468 106,950 19,209 103,589
Amortization of customer lists 54,387 44,857 — —
Amortization of favorable lease commitments 17,878 14,783 — —
Other expense, net 1,309 — — —
Transaction and other costs — — 23,544 —
Loss on disposition of Chef's Catalog — — — 15,348
Gain on credit card sale — — — (6,170
Operating earnings 476,803 258,708 70,263 397,438
Interest expense (income), net 259,805 217,665 (910 )12,261
Earnings from continuing operations before income taxes 216,998 41,043 71,173 385,177
Income taxes 82,295 14,595 26,226 141,373
Earnings from continuing operations 134,703 26,448 44,947 243,804
(Loss) earnings from discontinued operations, net of taxes (22,771 )(13,993 ) (793 )5,020
Net earnings $ 111,932 $ 12,455 $ 44,154 $ 248,824
See Notes to Consolidated Financial Statements.
F-7